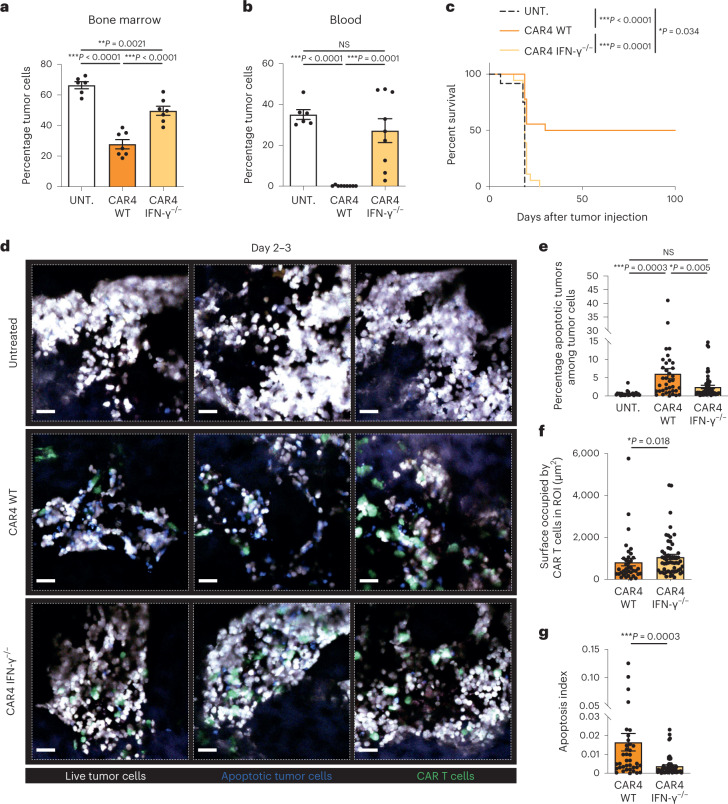
Fig. 2. CAR4 T cells rely on IFN-γ to control pro-B-cell tumors.
Pro-B-cell tumors were established by intravenous injection of 0.5 × 10⁶ Pro-B-DEVD cells in C57BL/6 mice after sublethal irradiation. Six days later, mice were injected intravenously with WT or IFN-γ−/− CAR4 T cells or left untreated. a, Percentage of tumor cells recovered from the bone marrow 3 d after the transfer of WT or IFN-γ−/− CAR4 T cells. Each dot represents one mouse (n = 6 untreated, n = 7 WT CAR4 T-cell-treated and n = 7 IFN-γ−/− CAR4 T-cell-treated mice from two independent experiments). One-way ANOVA was used for statistical analysis. b, Percentage of tumor cells detected in the blood 7 d after the transfer of WT or IFN-γ−/− CAR4 T cells. Each dot represents one mouse (n = 6 untreated, n = 9 WT CAR4 T-cell-treated and n = 9 IFN-γ−/− CAR4 T-cell-treated mice). One-way ANOVA was used for statistical analysis. c, WT CAR4 but not IFN-γ−/− CAR4 T-cell therapy prolonged mouse survival. Log-rank test was used for statistical analysis. Data are compiled from two independent experiments (n = 12 untreated, n = 18 WT CAR4 T-cell-treated and n = 18 IFN-γ−/− CAR4 T-cell-treated mice). d–g, Killing activity of WT or IFN-γ-deficient CAR4 T cells was assessed by intravital imaging of the bone marrow on days 2 and 3 after CAR T-cell transfer. Representative two-photon images of the bone marrow of pro-B tumor-bearing mice treated with WT or IFN-γ−/− CAR4 T cells (d). CAR T cells are shown in green, live tumor cells in white and apoptotic tumor cells in blue. Scale bars, 30 µm. Quantification of the percentage of apoptotic tumors (ratio of the surface occupied by apoptotic tumors to the total surface occupied by tumor cells) (e) and the surface occupied by CAR T cells in the ROI (f). An apoptosis index was calculated for WT and IFN-γ−/− CAR4 T cells by normalizing the percentage of apoptotic tumors as calculated in e to the surface occupied by CAR T cells as calculated in f (g). Data shown in d–g are compiled from n = 2 independent experiments. Each dot represents an individual tumor region (n = 25 tumor regions from n = 3 untreated mice, n = 37 tumor regions from n = 3 WT CAR4 T-cell-treated mice and n = 57 tumor regions from n = 4 IFN-γ−/− CAR4 T-cell-treated mice). One-way ANOVA (e) and two-tailed Mann–Whitney U-tests (f,g) were used for statistical analysis. Data are expressed as mean ± s.e.m. ***P < 0.001; **P < 0.01; *P < 0.05; NS, not significant.

