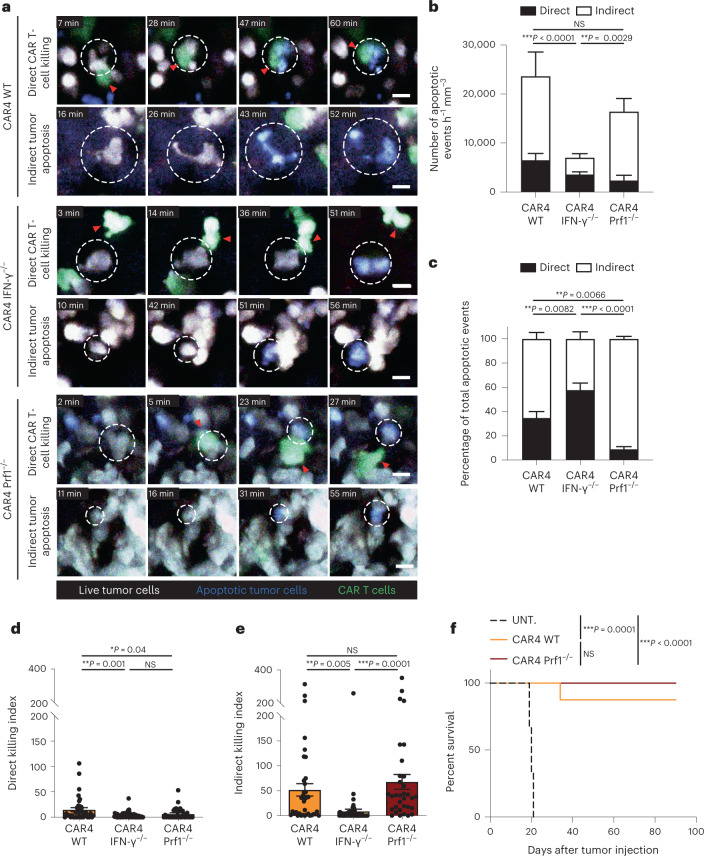
Fig. 3. CAR4 T cells eliminate B-cell tumors using both IFN-γ-dependent and perforin-dependent mechanisms.
Pro-B-cell tumors were established in C57BL/6 mice after sublethal irradiation. Six days later, mice were injected with WT, IFN-γ−/− or Prf1−/− CAR4 T cells. a, Two-photon timelapse images showing direct and indirect tumor apoptotic events mediated by CAR4 T cells. Apoptotic events (detected by the FRET-based reporter for caspase 3 activity) were classified as direct killing when a CAR T cell contacted the target cell before FRET loss detection. Indirect events corresponded to tumor cells showing FRET loss without detectable interactions with CAR T cells. Red arrowheads show CAR T cells associated with killing. White dashed circles illustrate tumor cells undergoing apoptosis. CAR T cells are shown in green, live tumor cells in white, and apoptotic tumor cells in blue. Scale bars, 10 µm. b,c, Quantification (normalized per hour and per surface area) (b) and proportion (c) of tumor apoptotic events. A total of n = 216, n = 126 and n = 259 apoptotic events were recorded for WT, IFN-γ−/− and Prf1−/− CAR4 T cells, respectively. Two-way ANOVA and Sidak’s multiple comparisons were used for statistical analysis. d, A direct killing index was calculated as the ratio of normalized direct apoptotic events to the surface occupied by CAR T cells in each image. Each dot represents one tumor region (n = 37, n = 57, n = 33 for WT, IFN-γ−/− and Prf1−/− CAR4 T cells, respectively). One-way ANOVA and Tukey’s multiple comparisons were used for statistical analysis. e, An indirect killing index was calculated as the ratio of normalized indirect apoptotic events to the surface occupied by CAR T cells in each image. Each dot represents one tumor region. One-way ANOVA and Tukey’s multiple comparisons were used for statistical analysis. Compiled from multiple regions imaged after the transfer of WT CAR4 T cells (n = 3 mice, n = 26 h of video analyzed), IFN-γ−/− CAR4 T cells (n = 4 mice, n = 42 h of video analyzed) and Prf1−/− CAR4 T cells (n = 3 mice, n = 46 h of video analyzed) from n = 2 independent experiments. f, WT and Prf1−/− CAR4 T cells similarly prolong mouse survival. Log-rank test was used for statistical analysis (n = 6 untreated, n = 8 WT CAR4 T-cell-treated and n = 9 Prf1−/− CAR4 T-cell-treated mice). Data are expressed as mean ± s.e.m. ***P < 0.001; **P < 0.01; *P < 0.05; NS, not significant.

