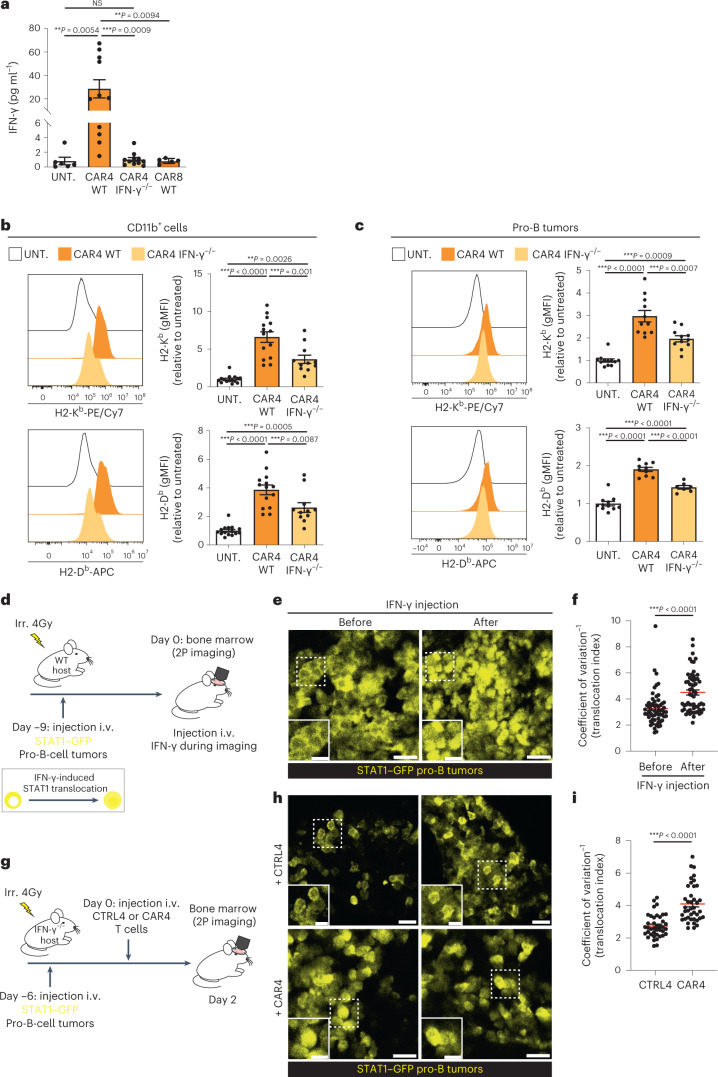
Fig. 4. CAR4 T-cell-derived IFN-γ diffuses extensively in the tumor microenvironment.
a–c, Pro-B-cell tumors were established in C57BL/6 mice after sublethal irradiation. Six days later, mice were injected with the indicated population of CAR T cells. CAR4 T cells represent the major source of IFN-γ (a). Serum IFN-γ was measured 3 d after CAR T-cell transfer. Each dot represents one mouse (n = 6 untreated, n = 11 WT CAR4 T-cell-treated and n = 11 IFN-γ−/− CAR4 T-cell-treated mice from n = 3 independent experiments and n = 5 WT CAR8 T-cell-treated mice from n = 2 independent experiments). One-way ANOVA and Tukey’s multiple comparisons were used for statistical analysis. MHC class I molecule upregulation was assessed on CD11b+ myeloid cells (b) and tumor cells (c) 3 d after cell transfer. Pooled from n = 4 (n = 15 untreated, n = 14 WT CAR4 T-cell-treated and n = 11 IFN-γ−/− CAR4 T-cell-treated mice) (b) and n = 3 (n = 11 untreated, n = 10 WT CAR4 T-cell-treated and n = 7 IFN-γ−/− CAR4 T-cell-treated mice) (c) independent experiments. Each dot represents one mouse. One-way ANOVA and Tukey’s multiple comparisons were used for statistical analysis. d, Tumors were established by injection of pro-B cells expressing a STAT1–GFP reporter into C57BL/6 mice after sublethal irradiation. Nine days later, mice were subjected to intravital imaging of the bone marrow before and after the i.v. injection of IFN-γ (10 µg). 2P, two-photon. e, Two-photon images showing the nuclear translocation of STAT1 after the injection of IFN-γ. Scale bars, 20 µm. f, A translocation score was computed for tumor cells before or after IFN-γ injection. Each dot represents one cell (n = 60 cells). Two-tailed Mann–Whitney U-test was used for statistical analysis. g, Pro-B-cell tumors were established by injection of pro-B cells expressing STAT1–GFP reporter into IFN-γ−/− mice after sublethal irradiation. Mice were injected with CAR4 T cells or untransduced CD4+ T cells (CTRL4) and subjected to intravital imaging of the bone marrow 2 d later. h, Two-photon images showing the nuclear translocation of STAT1 in tumor cells upon the treatment with CAR4 T cells but not CTRL4 T cells. Scale bars, 20 µm. i, The translocation score was computed from mice treated with CTRL4 (n = 40 cells, representative of n = 5 videos) or CAR4 (n = 40 cells, representative of n = 10 videos) T cells. Each dot represents one cell. Two-tailed Mann–Whitney U-test was used for statistical analysis. Data are expressed as mean ± s.e.m. ***P < 0.001; **P < 0.01; *P < 0.05; NS, not significant.

