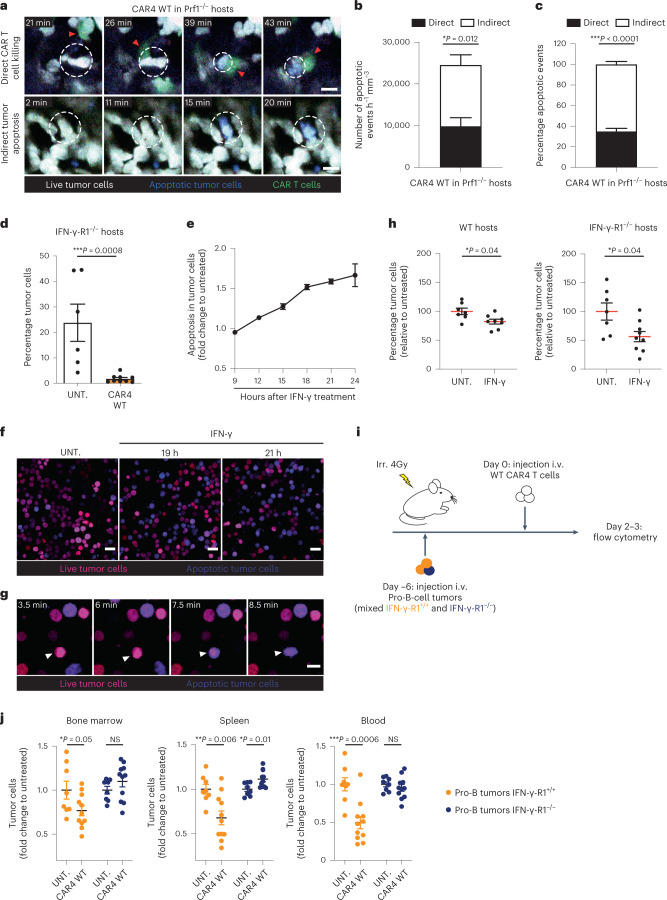
Fig. 5. CAR4 T-cell-derived IFN-γ directly acts on tumor cells to promote tumor apoptosis.
a–c, Pro-B-cell tumors were established in Prf1−/− mice and treated with CAR4 T cells. Two-photon timelapse images illustrating direct and indirect tumor apoptotic events (a). Scale bars, 10 µm. Quantification (normalized per hour per imaged surface) (b) and proportion (c) of direct and indirect tumor apoptotic events (n = 540 apoptotic events, n = 4 mice, n = 51.8 h of video analyzed) from n = 3 independent experiments. Two-tailed Mann–Whitney U-tests were used for statistical analysis. d, Tumor-bearing IFN-γ-R1−/− hosts were treated with CAR4 T cells or left untreated. Percentage of tumor cells recovered from the bone marrow 3 d after cell transfer. Data were compiled from n = 2 independent experiments (n = 6 untreated and n = 9 CAR4 WT-treated mice). Two-tailed Mann–Whitney U-test was used for statistical analysis. e, Pro-B-DEVD cell tumors were incubated with 50 ng ml−1 IFN-γ and cell apoptosis was assessed by flow cytometry and expressed as a fold change relative to untreated cells. Each dot represents the mean of three technical replicates (from n = 2 independent experiments). f, Pro-B-cell tumors were incubated with IFN-γ (50 ng ml−1) or left untreated and subjected to live imaging. Images showing live tumor cells (magenta) and apoptotic tumor cells (blue). Scale bars, 20 μm. g, Images highlighting a pro-B-cell tumor undergoing apoptosis after 19 h of incubation with IFN-γ. Scale bar, 10 μm. Images are representative of n = 2 independent experiments. h, Tumor-bearing WT (left) and IFN-γ-R1−/− (right) recipients were injected twice with 10 µg IFN-γ 24 h apart. Percentage of tumor cells (relative to untreated mice) in the bone marrow 2 d after the first IFN-γ injection. Data were compiled from n = 2 independent experiments (WT hosts, n = 7 untreated and n = 8 IFN-γ treated mice; IFN-γ-R1−/− hosts, n = 7 untreated and n = 9 IFN-γ treated mice). Two-tailed Mann–Whitney U-tests were used for statistical analysis. i, Tumors were established in CD45.1+ mice by injection of a mixture of CD45.1+ IFN-γ-R1+/+ and CD45.2+ IFN-γ-R1−/− pro-B cells. Six days later, mice were injected with CAR4 T cells. j, Tumor load (relative to untreated mice) was analyzed in the bone marrow (left), spleen (middle) and blood (right) 2–3 d after injection of CAR4 T cells. Data were compiled from n = 3 independent experiments. Each dot represents one mouse (n = 8 untreated and n = 11 CAR4 WT-treated mice). Two-tailed unpaired t-tests were used for statistical analysis. Data are expressed as mean ± s.e.m. ***P < 0.001; **P < 0.01; *P < 0.05; NS, not significant.

