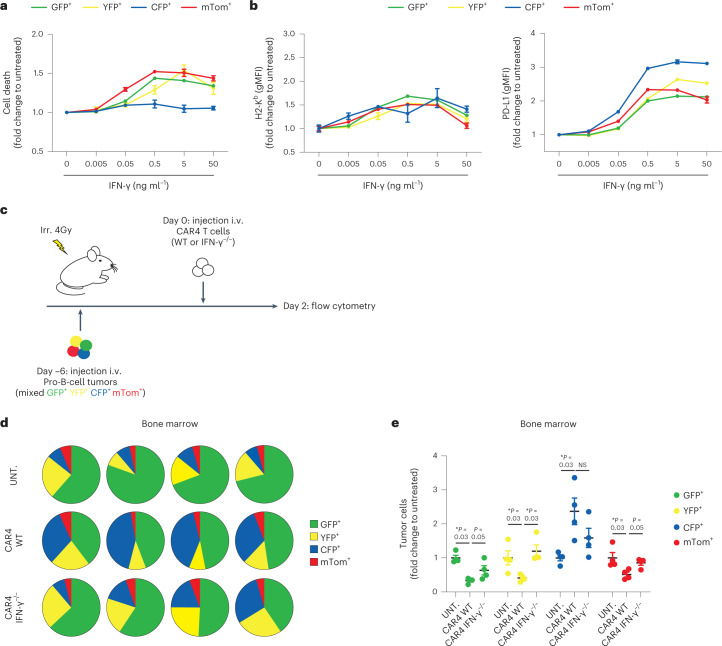
Fig. 6. CAR4 T cells selectively eliminate IFN-γ-sensitive tumor cells.
a,b, Impact of IFN-γ on different pro-B-cell tumors in vitro. Distinct, independently generated, pro-B-cell tumors were incubated with the indicated IFN-γ concentrations in vitro for 24 h. Cell death was assessed using Fixable Viability Dye (Zombie NIR) and expressed as a fold change relative to untreated cells (a). Each dot represents the mean of three technical replicates. IFN-γ induces phenotypic changes in all pro-B-cell tumors in vitro (b). Pro-B-cell tumors were incubated with the indicated IFN-γ concentrations in vitro for 24 h. H2-Kb (left) and PD-L1 (right) surface expression was then analyzed by flow cytometry. Each dot represents the mean of three technical replicates. gMFI, geometric mean fluorescence intensity. c, In vivo experimental setup. Pro-B-cell tumors were established by intravenous injection of 0.8 × 10⁶ of color-coded pro-B cells (1:1:1:1 ratio of a mix of CFP+GFP+YFP+mTom+ pro-B cells) in C57BL/6 mice after sublethal irradiation. Six days later, mice were injected intravenously with WT or IFN-γ−/− CAR4 T cells. Two days after CAR T-cell transfer, bone marrow cells were processed using flow cytometry. d, Pie charts showing the distribution of individual colored pro-B tumors in the bone marrow two days after injection of CAR4 T cells. Each pie chart represents one mouse. e, Tumor cellular composition (fold change relative to untreated mice) was analyzed in the bone marrow 2 d after injection of CAR4 T cells. Each dot represents one mouse. Two-tailed Mann–Whitney U-tests were used for statistical analysis. Data shown in a–e are representative of n = 2 independent experiments (n = 4 mice per group). Data are expressed as mean ± s.e.m. *P < 0.05; NS, not significant.

