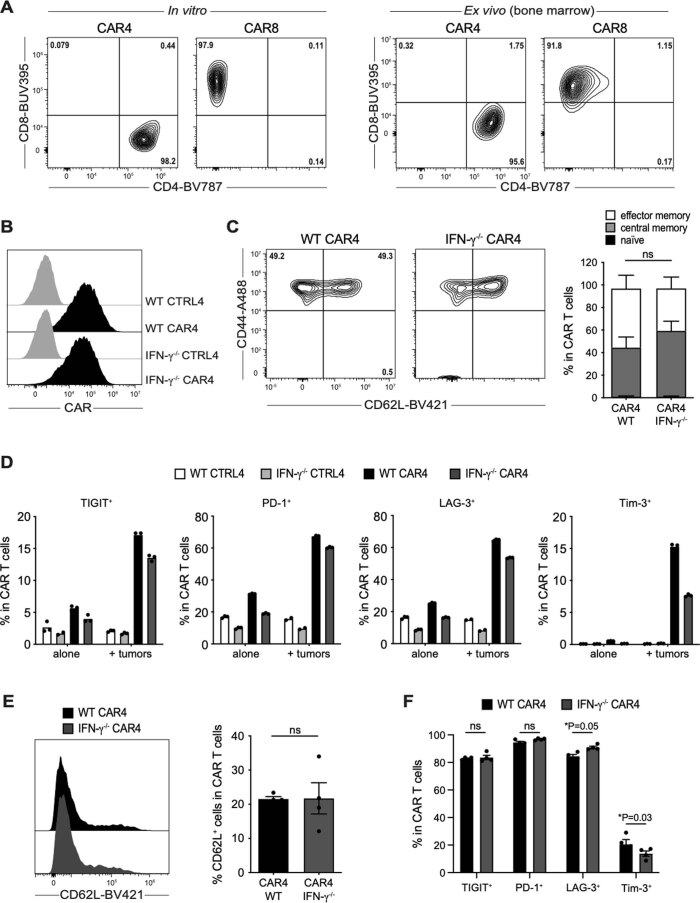
Extended Data Fig. 1. In vitro and ex vivo phenotyping of CAR T cells.
(a) CD4 and CD8 surface expression by CAR4 and CAR8 T cells (representative of n = 6 independent experiments). (b) CAR expression by WT and IFN-γ−/− CD4+ T cells (representative of n = 8 independent experiments). CTRL4, untransduced control CD4+ T cells. (c) Representative FACS plot (left) and bar graphs (right) showing the percentage of effector/effector memory (CD44+ CD62L−), central memory (CD44+ CD62L+) and naive T cells (CD44− CD62L+) in WT and IFN-γ−/− CAR4 T cells (pooled from n = 3 independent experiments). Two-way ANOVA and Sidak’s multiple comparisons were used for statistical analysis. (d) Percentage of TIGIT, PD-1, LAG-3 and Tim-3 positive cells in WT and IFN-γ−/− CAR4 T cells and their untransduced counterparts (CTRL4) after co-culture (or not) with pro-B-DEVD tumors at 1:1 effector-to-target ratio for 24 hours. Each dot represents one technical replicate (n = 1 experiment). (e, f) Ex vivo analysis of CAR4 T cells recovered from the bone marrow of pro-B-cell tumor-bearing mice 3 days after the treatment with WT or IFN-γ−/− CAR4 T cells (10 × 106). (e) Representative histograms (left) and bar graphs (right) showing the percentage of CD62L expressing cells in WT and IFN-γ−/− CAR4 T cells. Each dot represents one mouse (n = 4 mice per group). Two-tailed Mann-Whitney U-test was used for statistical analysis. (f) Percentage of TIGIT, PD-1, LAG-3 and Tim-3 positive cells in WT and IFN-γ−/− CAR4 T cells recovered from the bone marrow 3 days after their transfer. Each dot represents one mouse (n = 4 mice per group). Two-way ANOVA and Sidak’s multiple comparisons were used for statistical analysis. Data are expressed as mean ± SEM. *P<0.05; ns, not significant.

