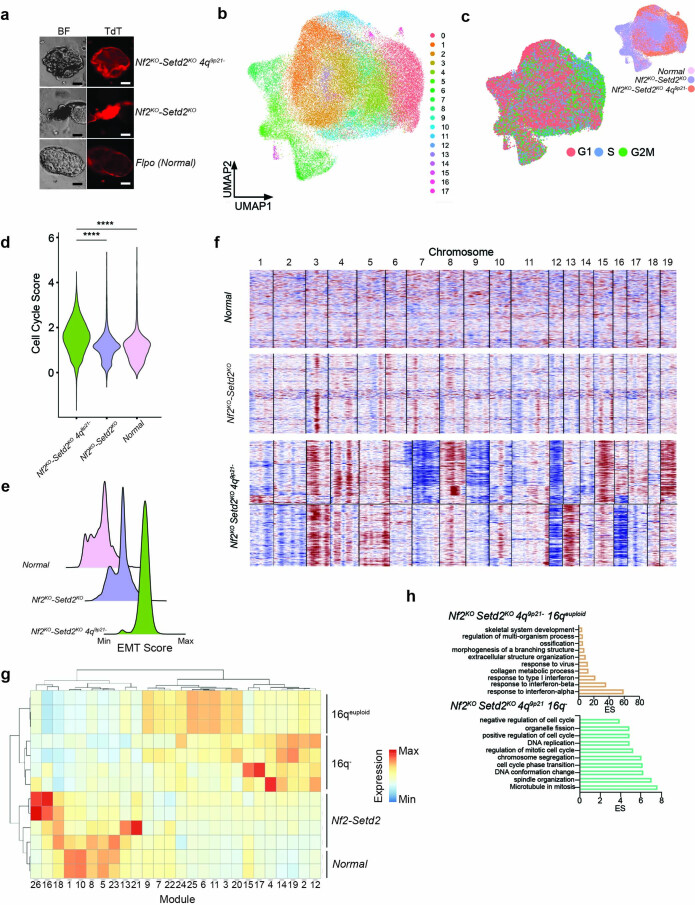
Extended Data Fig. 6. scRNA sequencing characterization of GEKOs.
a) Microscopic representative pictures of GEKOs 10 weeks after AAV transduction for the three different experimental groups. Images representative of N = 3 experiments (left: brightfield; right: tdTomato). b) Bi-dimensional cluster distribution of the 87718 GEKOs cells after filtering and quality control distributed on a UMAP plot. c-d) Cell cycle status and group distribution of single GEKOs cells as calculated by Seurat (c) and violin plot of Cell cycle score values (d), p < 1*10-15, for the 3 different experimental groups. N = 87718 cells. e) Ridge plots of representing the distribution of single cells along a calculated EMT signature (EMT Score). f) Copy number heatmap of representative samples of the Normal, Nf2KO-Setd2KO and Nf2KO-Setd2KO-4q9p21 experimental groups generated by InferCNV; CIN can be appreciated in the Nf2KO-Setd2KO-4q9p21 with recurrent CNA patterns. g) Heatmap showing upregulated and downregulated modules as calculated by Moncole3 in the 4 distinct genomic groups. A clear difference among modules can be appreciated between 16qeuploid and 16q-. h) Over representation pathway analysis of top markers calculated by Seurat for the 16qeuploid (top panel) and 16q- (bottom panel) cell lines. **** P < 0.0001 by Mann-Whitney test (d).

