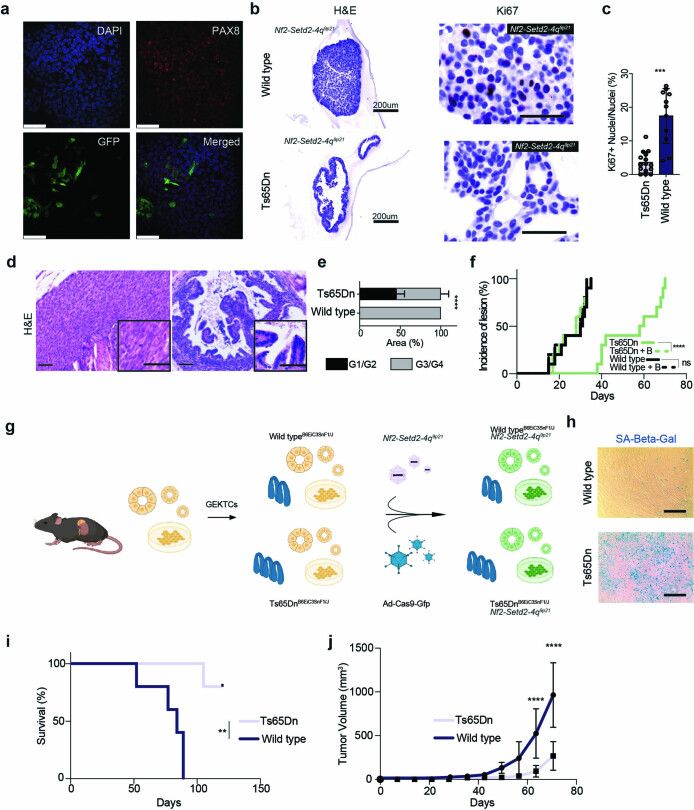
Extended Data Fig. 10. An extra copy of the IFNR cluster is sufficient to restrains malignant transformation in RCC.
a) Confocal images of a GEKO infected with Ad-Cas9-GFP. The positive staining with the renal marker PAX8 confirmed a tubular origin of this organoids; GFP staining confirmed the successful transduction. Scale bar: 100μm b-c) Representative histopathological images of “Wild type” and “Ts65Dn” GEKOs cotransduced with sgRNAs-carrying AAV and Ad-Cas9-GFP stained for the proliferation marker Ki67 (b) and relative quantification (c), data are presented as mean values +/- SD, p value = 3.17*10-6. Scale bar: 100μm (N = 15 for “Ts65Dn and N = 11 for “Wild type”) Images representative of N = 2 experiments. d-e) Representative H&E images showing sarcomatoid (left panel) and tubule-papillary like (right panel) morphology for “Wild type” and “Ts65Dn” GEKO-derived tumors respectively (e); quantification of “Ts65Dn” and “Wild type” GEKO-derived tumors with histological low grade (G1/G2) and high grade (G3/G4), data are presented as mean values +/- SD (N = 25 fields per each condition, p < 1*10-15) (e). Scale bar: 100μm f) Incidence curves of tumor bearing mice transplanted with “Ts65Dn” or “Wild type” GEKOs and treated with Vehicle or Baricitinib, p value = 4.47*10-6. g) Schematic showing the generation of GEKTCs. h) Representative images of “Wild type” and “Ts65Dn” GEKTCs stained for SA-Beta-Gal. Images representative of N = 3 experiments. I-j) Survival curves of “Ts65Dn” (N = 5 mice) and “Wild type” (N = 5 mice) GEKTC cell lines transplanted in immunocompromised mice and respective tumor growth curve, data are presented as mean values +/- SD, p values = 0.0026, 1.49*10-5 and 2.74*10-11 (j). Scale bar: 100μm. ** P < 0.01, *** P < 0.001, **** P < 0.0001 by student-T test (c) Chi test (e) log-rank (Mentel-Cox) test (f-i) and two-way ANOVA (j).

