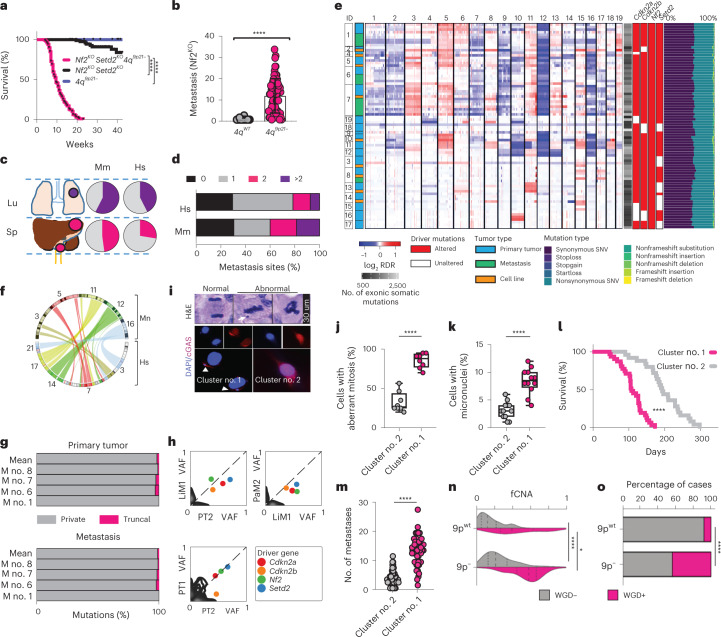
Fig. 2. CIN is a feature of aggressive metastatic RCC.
a, Kaplan–Meier survival analysis of Nf2KO-driven tumors with (n = 99 mice) and without (n = 84 mice) 4q9p21-targeting sgRNAs. P < 1 × 10⁻¹⁵. b, Box and whiskers plot showing metastatic burden of 4q9p21 (n = 69 mice) and 4qwt (n = 15 mice) models; data are presented as mean ± s.d., P = 1.16 × 10⁻⁶. c,d, Cross-species comparison of site-specific metastasis (c) and disease burden (d); Mm, Mus musculus, n = 79 mice; Hs, Homo sapiens. e, Summary heatmap showing WES results (n = 81 samples derived from 19 mice) (Supplementary Table 1). f, Circos plot of the human to mouse synteny map for chromosome regions significantly altered in SM-GEMM. Statistics derived from n = 81 samples. g, Bar charts showing the percentage of private and truncal somatic events at primary (upper panel) and metastatic sites (bottom panel). h, Density plots displaying the VAF of observed somatic mutations. i, Histological high-power field magnification of normal anaphase (top left) and aberrant metaphases (top right) with IFs for cGAS (red) and DAPI (blue) (middle and bottom panels). Arrows indicate micronuclei. Scale bar, 30 μm. Images representative of n = 3 experiments. j,k, Box and whiskers plots showing percentages of tumor cells with aberrant mitosis (j), data are represented as median values, minimum and maximum (26.6, 20, 56.6 for Cluster no. 2 and 70, 88 and 95 for Cluster no. 1, respectively); and with micronuclei (k), data are represented as median values, minimum and maximum (3, 1, 6 for Cluster no. 2 and 8.5, 4 and 12 for Cluster no. 1, respectively). n = 8 tumors per condition (j), n = 12 tumors per condition (k); P = 1.80 × 10⁻⁷ (j) and 1.34 × 10⁻⁶ (k). l,m, Kaplan–Meier survival analysis (l) and metastatic lesions count (m) in Cluster no. 1 and Cluster no. 2 RCC GEM models transplants; P = 3.08 × 10⁻¹⁰ (l, n = 57 mice) and <1 × 10⁻¹⁵ (m, n = 109 mice). n, Violin plot showing aneuploidy score with 9p status and WGD (9p−, n = 212 tumors; 9pwt, n = 710 tumors); P < 1 × 10⁻¹⁵ and P = 3.07 × 10⁻². o, Bar chart showing the prevalence of WGD in 9pwt and 9p− cases in TCGA and MSKCC datasets (n = 922 tumors); P < 1 × 10⁻¹⁵. *P < 0.05, ****P < 0.0001 by log-rank (Mantel–Cox) test (a,l), two-tailed t-test (b,j,k,m), two-tailed Mann–Whitney test (n) and two-sided Fisher’s exact test (o). Lu, lung; M, mouse; RDR, read depth ratio; Sp, splanchnic.

