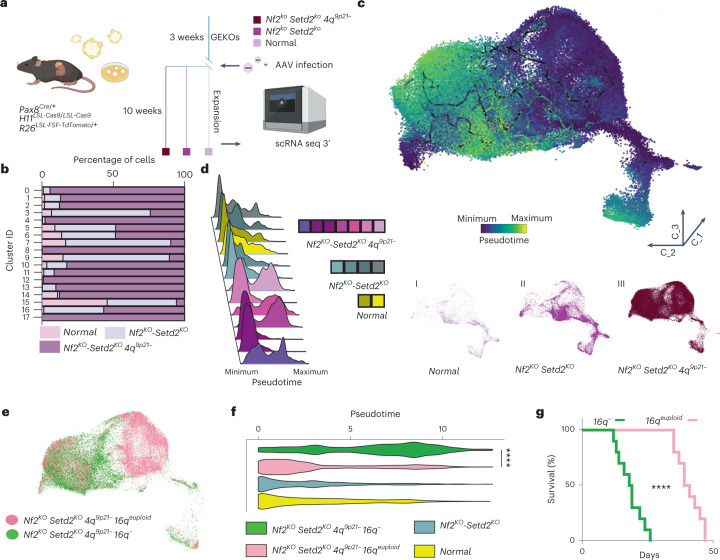
Fig. 3. Chromosome 16q loss is permissive for the emergence of aggressive tumors.
a, Schematic showing GEM model design for GEKOs generation (left) and experimental timeline (right) (dark purple, Nf2KO-Setd2KO-4q9p21−; purple, Nf2 KO-Setd2 KO; pink, empty vector). b, Bar graph displaying distribution of cells among 18 different clusters for the 3 different experimental groups. c, Three-dimensional distribution of the 87,718 GEKO-derived cells; the color scale bar is based on pseudotime values. d, Distribution plots of individual samples according to pseudotime values (left panel) and three-dimensional distribution along the pseudotime of the three different experimental groups (right panels). e, Three-dimensional distribution across the pseudotime of cells with euploid 16q (Nf2KO-Setd2KO-4q9p21−16qeuploid, pink) and with 16q− (Nf2KO-Setd2KO-4q9p21−16q−, green). n = 87,718 cells. f, Violin plot showing pseudotime distributions in the four different genomic groups; P < 1 × 10⁻¹⁵. g, Kaplan–Meier survival analysis of CB17SC-F SCID mice inoculated orthotopically in the kidney with SM-GEMM-derived cell lines, 16q− (n = 10 mice) or 16qeuploid (n = 10 mice); P = 3.23 × 10⁻⁶. ****P < 0.0001 by two-tailed Mann–Whitney test (f) and by log-rank (Mantel–Cox) test (g).

