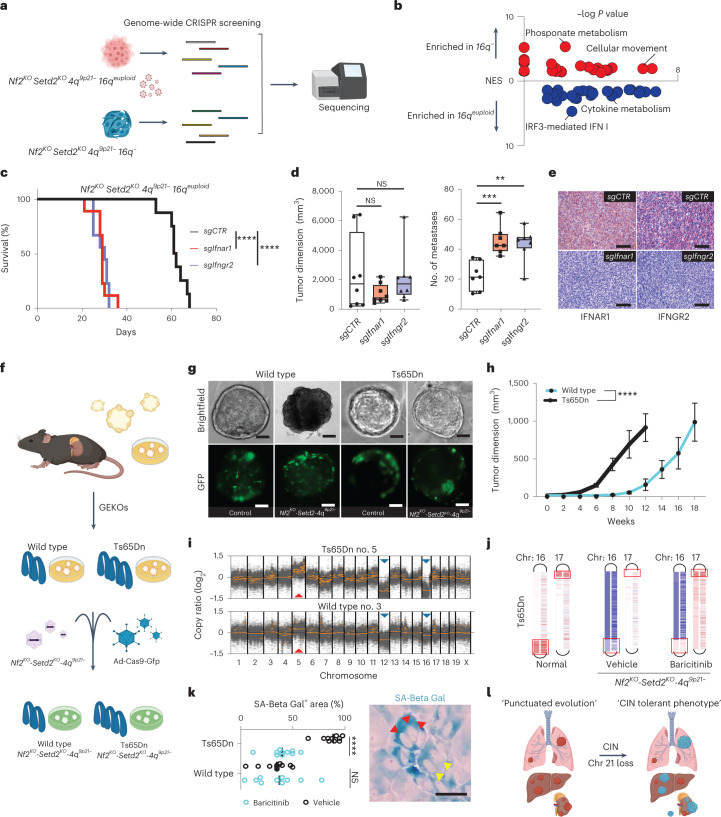
Fig. 6. IFNR drives a senescence response that limits RCC progression.
a, In vitro CRISPR screening schematic. b, Volcano plot showing enriched pathways in 16q− and 16qeuploid cell lines using as input the top ranked 2,000 TSGs. n = 60 differentially expressed pathways. c, Survival curve of 16qeuploid tumor-bearing mice with knockout of either Ifnar1 or Ifngr2; P = 3.44 × 10⁻⁵ and 4.20 × 10⁻⁵. n = 26 mice. d,e, Tumor dimensions and number of metastases; data are represented as median values, minimum and maximum (sgCTR: 1,702.5, 198, 6,394; sgIfnar1: 750, 405, 2,176; sgIfngr2: 1,702.5, 607, 6,250 for tumor dimensions; n = 9 tumors per group; and sgCTR: 21, 10, 34; sgIfnar1: 42, 35, 64; sgIfngr2: 46, 20, 57 for number of metastases; n = 8 tumors per group) (d); and IHC of IFNAR1 and IFNGR2 in primary tumors (e). P = 6.33 × 10⁻⁴, 2.72 × 10⁻³, 0.17, 0.63. Scale bar, 100 μm. f, Schematic of the experimental design and GEKO generation for the Ts65Dn model. g, Microscopic images of wild-type (top left) and Ts65Dn (top right) GEKOs coinfected with Ad-Cas9-GFP with or without the AAV-Nf2KO-Setd2KO- 4q9p21−. Scale bar, 30 μm. Images representative of n = 2 experiments. h, Growth curve of transformed wild-type and Ts65Dn GEKOs transplanted subcutaneously; data are presented as mean ± s.d. (wild type, n = 5 tumors; Ts65Dn, n = 5 tumors), P = 3.28 × 10⁻⁹. i, Scatter plots of GEKO wild-type- and Ts65Dn-derived tumors; red arrows, amplifications; blue arrows, deletions. j, Chromosome 16 and 17 diagrams showing regions of amplification and deletion; from left to right: normal tissue from Ts65Dn versus normal tissue from wild-type mouse; CRISPR-induced tumor from Ts65Dn treated with vehicle versus normal tissue from Ts65Dn; CRISPR-induced tumor from Ts65Dn treated with baricitinib versus normal tissue from Ts65Dn. Boxes represent the genomic region affected with partial trisomy in the Ts65Dn model. k, Quantification (left) and representative picture (right) of GEKTCs derived from wild-type and Ts65dn mice, treated with vehicle or baricitinib. n = 10 fields per condition, P = 2.10 × 10⁻⁸. Arrows indicate the presence of multiple nuclei in senescent cells. Scale bar, 30 μm. l, Schematic proposing loss of chromosome 21 as a cell-autonomous mechanism to CIN tolerance and evolution of advanced RCC. **P < 0.01, ***P < 0.001, ****P < 0.0001 by log-rank (Mantel–Cox) test, (c) two-way ANOVA (h) and two-tailed Student’s t-test (d,k). SA-Beta-Gal, beta-galactosidase.

