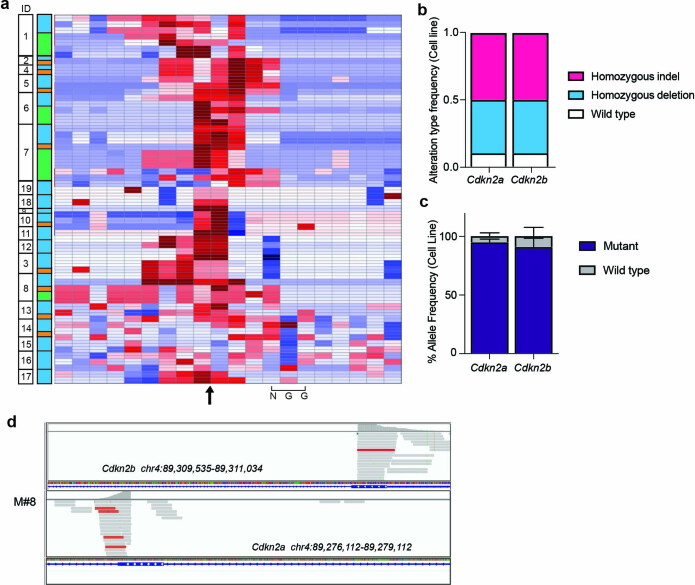
Extended Data Fig. 2. Efficiency of in vivo CRISPR/Cas9 genome editing in SM-GEMM of RCC.
a) Heatmap showing the average Z-transformed log odds ratio across all edited genes for the likelihood of specific base alterations in any reads spanning an expected cut site. Data in figure were generated from WES analysis of primary tumor samples and matched metastatic sites (N = 81 samples across 19 mice). b-c) Bar plot displaying type (b) and allelic frequency (c) of genomic alterations in Cdkn2a and Cdkn2b loci of tumor-derived cell lines from WES data analysis, data are represented as frequencies (b) and mean values +/- SD (c) (N = 4 and 5 cell lines respectively). d) Representative IGV snapshot showing homozygous deletion of the envisaged targeted ~ 40 kb region spanning Cdkn2a and Cdkn2b genes.

