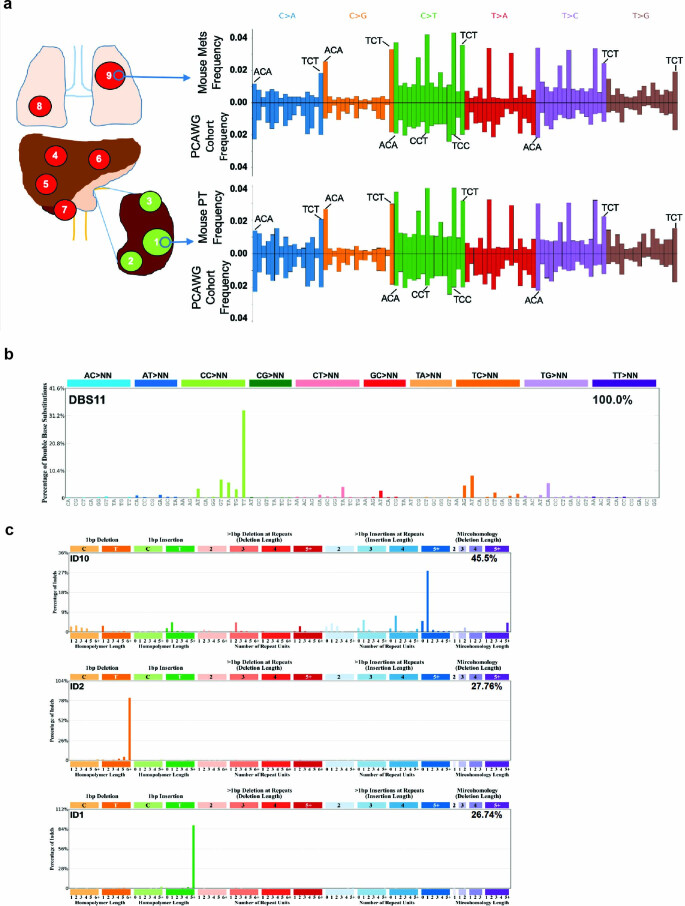
Extended Data Fig. 3. Mutational signatures of metastatic disease.
a) Trinucleotide context-specific somatic SNV frequencies as detected by WGS in 2 metastatic samples (upper panel), 6 primary tumors and 2 cell line samples (lower panel) as compared to corresponding trinucleotide context-specific somatic SNV frequencies in pan-kidney tumor cohort (n = 148 tumors) analyzed by WGS. b-c) Comprehensive SM-GEMM cohort frequency plot showing percentage of double base substitutions (b) and indels (c) as calculated from WES data analysis.

