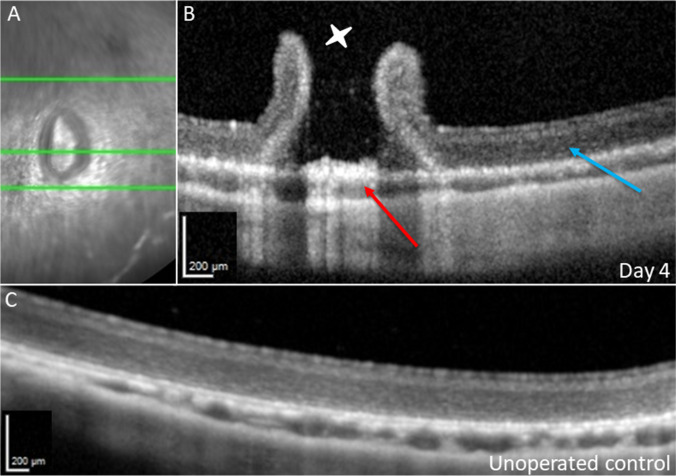
Fig. 3.
SD-OCT of bRD and retinotomy without RPE manipulation at 4 days post-operatively. (A) Infrared reflection image of the SLO. The green line marks the displayed cross-section in the corresponding SD-OCT image. (B) The red arrow shows central pigment epithelial hypertrophy at the retinotomy (white star) surrounded by raised retinal margins. Otherwise, near-normal retinal/choroidal OCT reflection bands can be discerned (blue arrow). In comparison, (C) shows a preoperative OCT, showing nearly the same reflection bands as in (B)

