
Fig. 3.
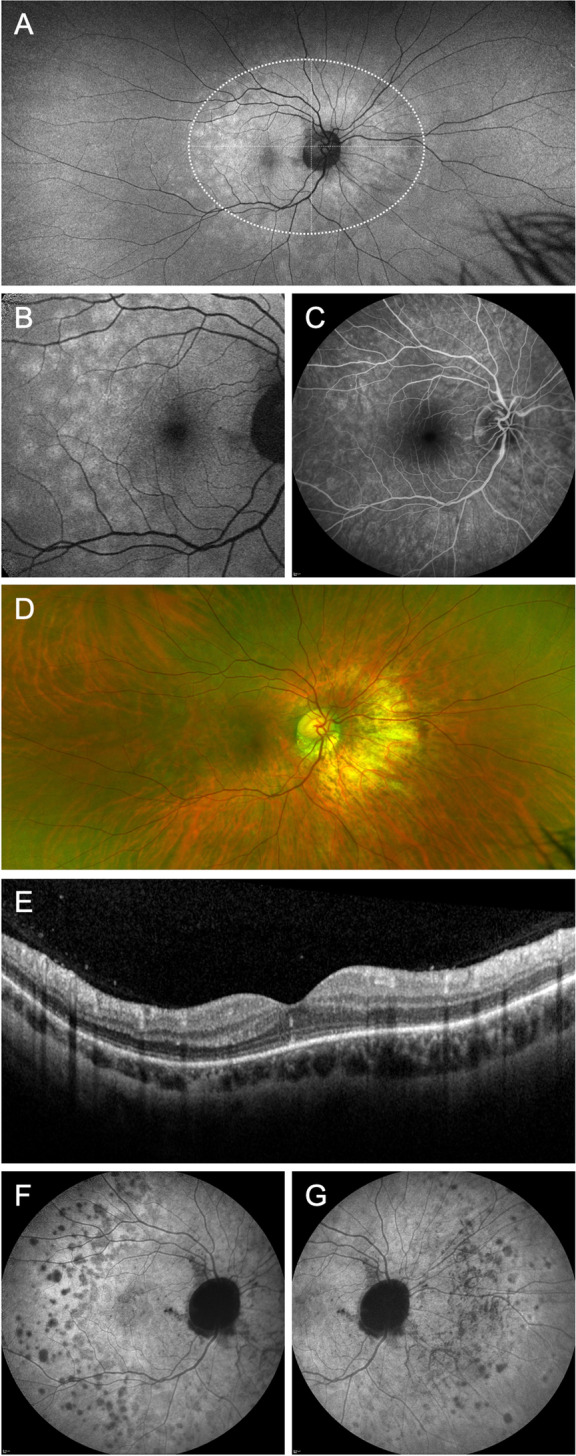
Multimodal imaging (patient #21) demonstrates the importance of different imaging modalities in diagnosing MEWDS, particularly in patients with high myopia. Widefield autofluorescence imaging (A) shows the lesions to be centered on the disc, which is not illustrated in 30° autofluorescence images (B). Fluorescein angiography (C) and widefield pseudo-color images (D) showed only faint lesions. Typical disruption of the ellipsoid band is shown on the macular OCT image (E). Late-phase indocyanine green angiography (30 − 40 min; F, G) shows hypocyanescent dots typical for MEWDS and highlights peripapillary breaks in Bruch’s membrane that are present concurrently. To determine the topography of retinal lesions, a horizontal and vertical line (maximum width) was drawn through the area of the chorioretinal spots on ultra-widefield AF imaging (A)