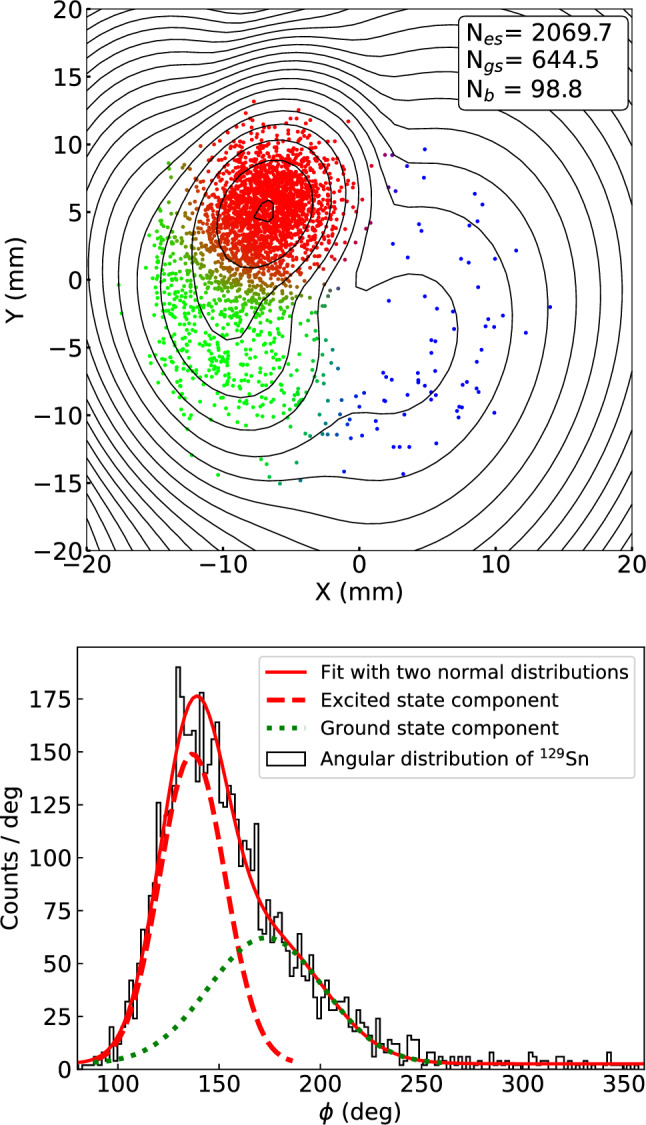
Fig. 3.

Upper panel: The phase image of the reduced cyclotron motion for Sn ions obtained with a phase accumulation time of 1010 ms. The color mixture of each point represents the probabilities of belonging to the excited state (red), the ground state (green), or the background (blue). The determined number of nuclei in each component from the phase image is estimated by the BGM model. Contour lines represent the normal distributions of the components of the BGM model. Lower panel: The angular distribution of the data. The solid red curve shows a least square fit of the angular distribution with a double normal distribution. The dashed lines show the excited state and the ground state component of the fitted distribution
