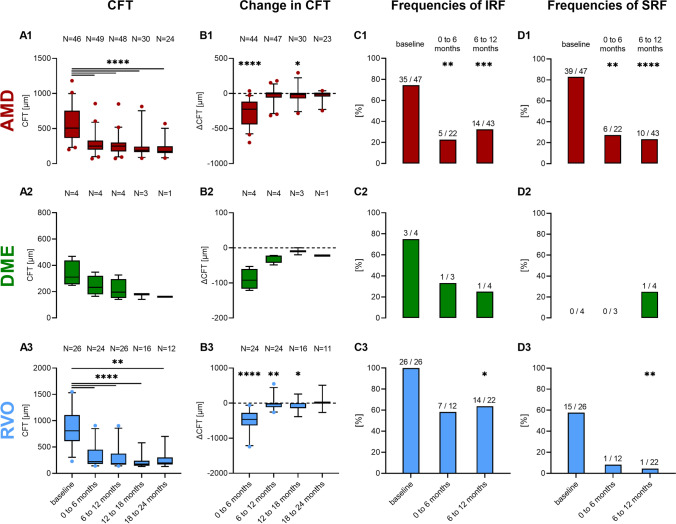
Fig. 2.
CFT (A1–A3) and change in CFT (B1–B3) of AMD (red), DME (green), and RVO (blue) patients. CFT at various time intervals (0 to 6, 6 to 12, 12 to 18, and 18 to 24 months) after starting intravitreal VEGF-inhibitor therapy was compared to baseline (sign test), and change in CFT was compared to zero (sign test). Relative frequencies (bar) and actual counts (annotation above bars) of patients with IRF (C1–C3) and SRF (D1–D3) on SD-OCT. IRF and CRF frequencies during the 0- to 6-month and 6- to 12-month period were compared to baseline (McNemar test). *P < 0.05, **P < 0.01, ***P < 0.001, ****P < 0.0001

