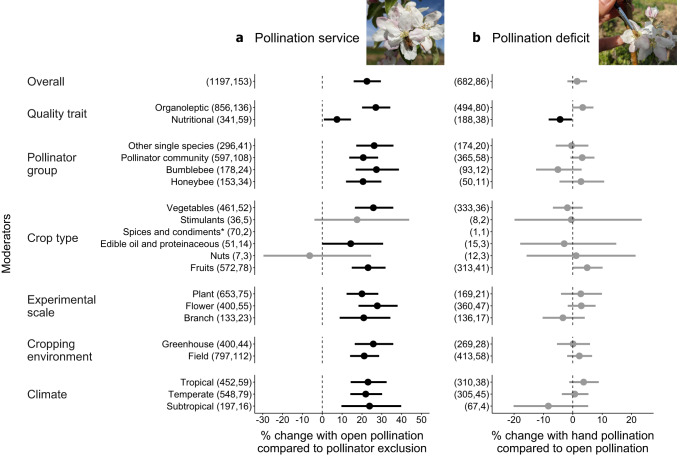
Fig. 3. Change in food crop quality for different moderators used in the pollination service (a) (k=1197 effect sizes) and pollination deficit (b) (k = 682 effect sizes) datasets.
Bars around the means indicate 95% CI. Bars not intersecting with zero (dashed line) are coloured in black and indicate a statistically significant change. Estimates are derived from models without the intercept to test within-group differences. The overall pollination outcome was estimated as the pooled effect size (null model). The first and second numbers in parentheses following each moderator level name indicate, respectively, the number of effect sizes used to derive the displayed statistics, and the number of studies included in each calculation. *To improve figure clarity, non-significant effect sizes for spices and condiments are not shown as they exceed figure limits (Mean (95% CI) for pollination service: 27.8% (−11.3%: 84.1%); and pollination deficit: 73.0% (−19.5%: 271.5%). For a full figure displaying all effect sizes for each moderator level refer to Supplementary Fig. 4.

