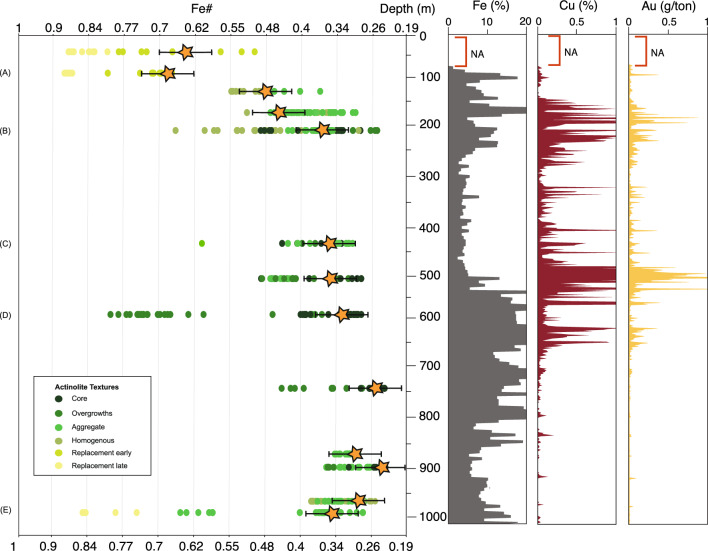
Figure 2.
Calculated Fe# of actinolite plotted as a function of depth in drill core LD1687. Letters (A) to (E) indicate samples with calculated Fe# distribution maps (see Fig. 3). Letters correspond to the maps in Fig. 3. The vertical plots display variation of the Fe, Cu and Au contents with depth that were calculated from whole rock from half drill core samples 2m long (Lundin Mining, pers. comm.). Orange stars correspond to average Fe# values from early paragenetic textures (e.g. grain cores).

