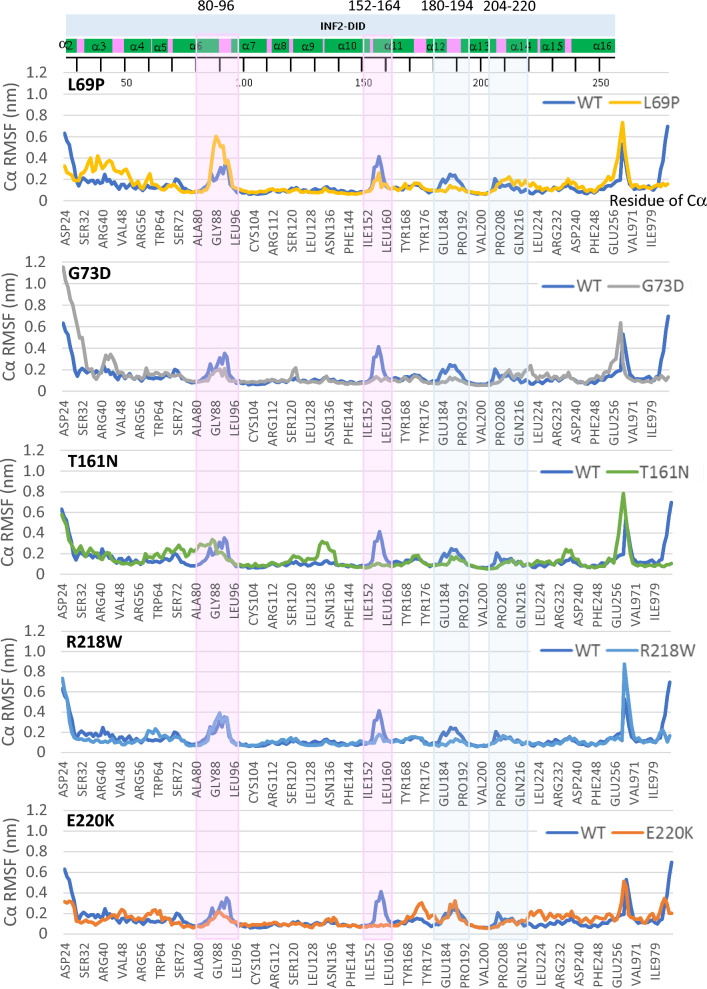
Figure 5.
Comparison of molecular dynamics between INF2 wild-type and variants by Root-mean-square fluctuation (RMSF) plots. RMSF scores are shown by per residue of INF2-DID domain based on the Cα MD simulations of during 500 ns, assuming an aqueous solution. We used the simulation trajectories of the last 400 ns, the time interval at which the structure has become stable. A pair-wise comparison of trajectories between the wild-type INF2 (WT) and pathogenic variants displays the altered residual fluctuations in the DID domain. The highest (80–96, 152–164) and moderate-high fluctuating regions (180–194, 204–220) in the WT and pathogenic variants are highlighted with a light-pink and light-blue-shaded background, respectively. The first peak of fluctuation at residues 80–96 is increased (L69P), is broaden with split (T161N), is decreased (G73D, E220K), and is unchanged (R218W). The second peak of fluctuation at residues 152–164 is lost for four variants (G73D, T161N, R218W, E220K), while being preserved for L69P. The consensus secondary structure is shown schematically with α helices (green) and loops (pink).

