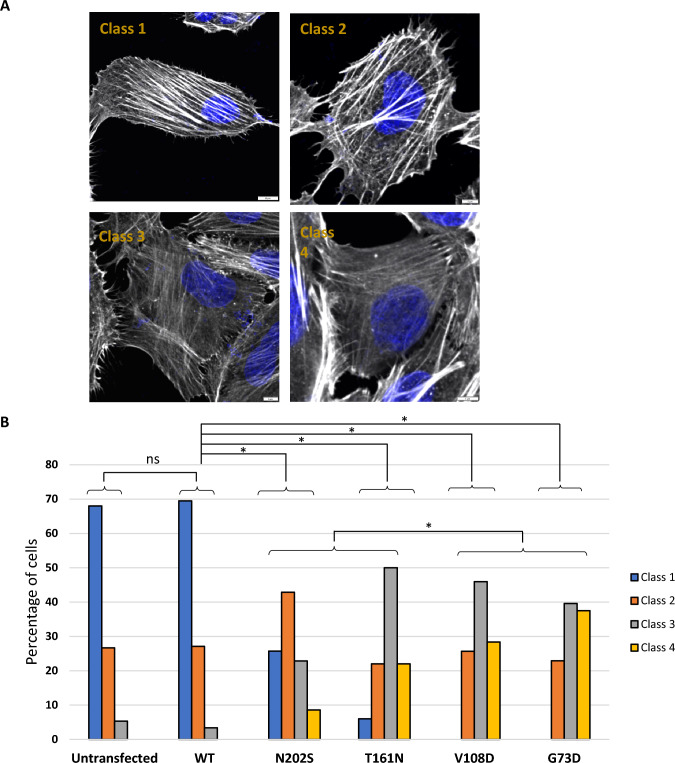
Figure 8.
INF2 variants alter actin networks in HeLa cells expressing wild-type or pathogenic INF2 variants. (A) Representative images of four subgroups of actin stress fiber patterns. Confocal images were subdivided according to previous study22,23. Class 1: heavy, distinct cables cross > 90% of the central area of the cell; Class 2: at least two heavy, distinct cables enter the central half of the cell and the remaining area is filled with fine cables; Class 3: cells have only fine cables; and Class 4: no cables are detectable in the central area. Scale bars: 10 µm. (B) Histogram showing a proportional distribution of F-actin phenotypes. Immunofluorescence images (n = 100) were visually inspected and scored by two independent investigators. The proportional distributions of actin phenotype categories were significantly different between wild-type INF2 (WT) and each variant, and between FSGS- and CMT/FSGS-causing variant subgroups. Inter-subgroup differences were analyzed by Fisher exact test with multiple testing correction: not significant (ns) or significant (asterisks).

