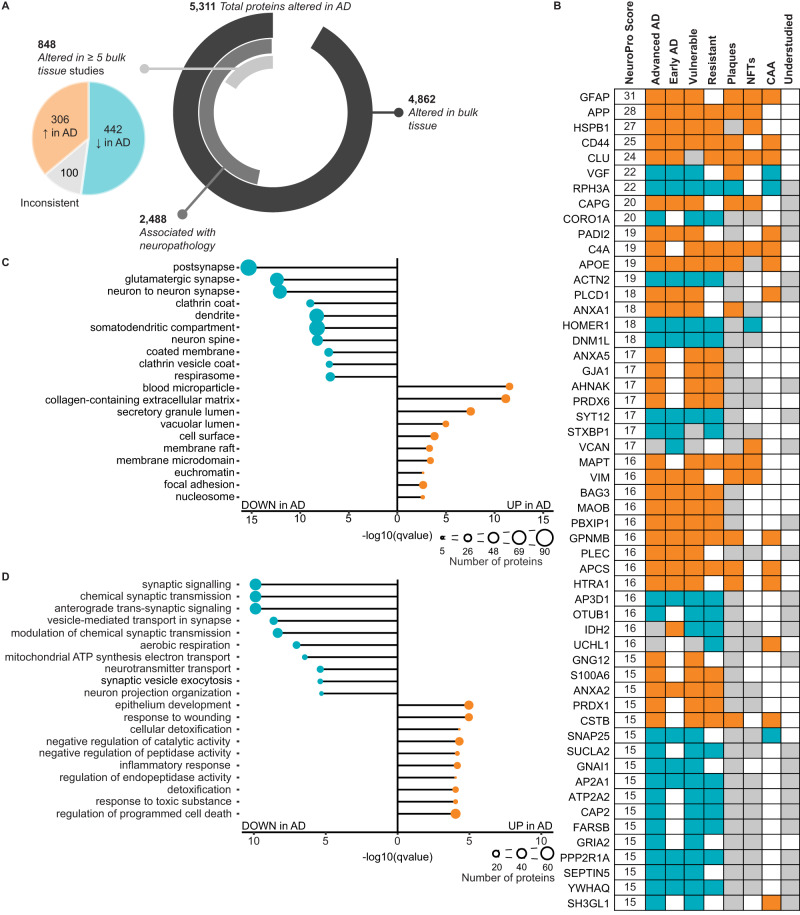
Fig. 2. Most consistent protein differences in AD human brain tissue.
A Breakdown of the number of protein differences in NeuroPro. The pie chart shows the breakdown of 848 proteins altered in ≥5 bulk tissue studies into consistently increased, consistently decreased and inconsistent subgroups. B 54 most common protein changes in AD. NeuroPro score: number of studies, a protein was significantly altered in. Orange: consistently increased. Blue: consistently decreased. Grey: inconsistently altered. Grey (understudied column): ≤10 studies linking protein with AD. C, D Most enriched GO terms for proteins (C cellular component; D biological process) that are consistently upregulated (306 proteins) or consistently downregulated (442 proteins) regulated in AD altered in ≥5 bulk tissue studies. AD Alzheimer’s disease, NFTs neurofibrillary tangles, CAA cerebral amyloid angiopathy.

