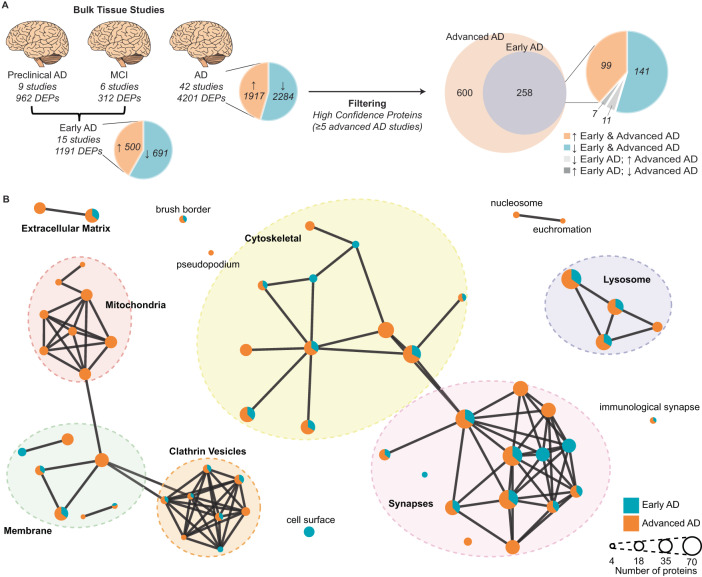
Fig. 5. Comparison of protein changes in early-stage and advanced AD.
A Filtering method used to identify high-confidence early-stage and advanced AD protein changes. Proteins that were consistently altered in the same direction in each of the three AD clinical stages were identified (DEPs). Inconsistent proteins within a clinical stage were removed. Preclinical AD and MCI were combined to generate an early AD group. Pie charts specify the number of proteins that are increased/decreased in AD vs controls. Protein changes were filtered to identify high-confidence protein changes in early-stage and advanced AD (altered in ≥5 bulk tissue studies). B GO term (cellular component) network clusters, mapped to show clusters of similar GO terms which were manually annotated to show the overarching cellular component linked to major clusters of GO terms. Each node represents a unique GO term. Node colour shows the proportion of proteins for each enriched GO term that were altered in early-stage AD (blue) and advanced AD (orange). AD Alzheimer’s disease, MCI mild cognitive impairment, DEPs differently expressed proteins.

