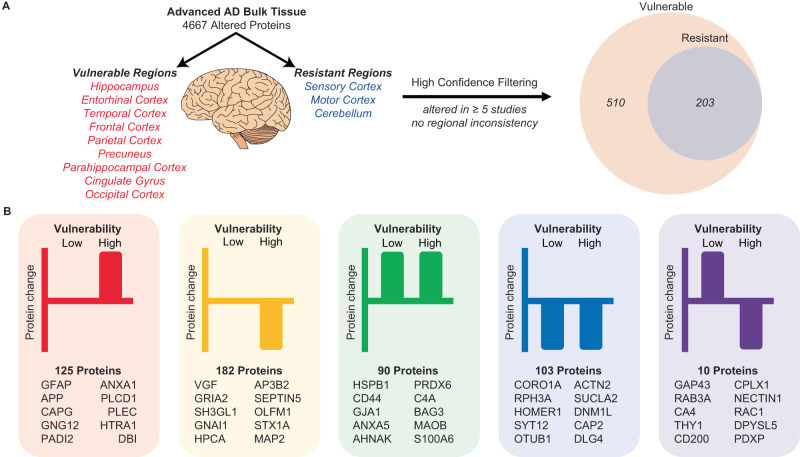
Fig. 6. Comparison of protein changes in vulnerable and resistant brain regions.
A Filtering methodology used to identify high-confidence protein changes observed in vulnerable and resistant brain regions. Proteins were only considered high-confidence protein changes if they were altered in ≥5 bulk tissue studies. B distribution of protein changes into five types of protein changes: proteins increased (red) or decreased (yellow) in vulnerable regions only, proteins increased (green) or decreased (blue) in both vulnerable and resistant regions, proteins increased in resistant regions and decreased in vulnerable regions (purple). Proteins with the highest total NeuroPro score in each group are specified. AD: Alzheimer’s disease.

