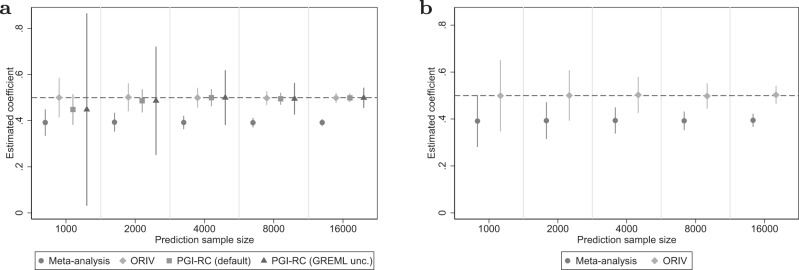
Fig. 1. Variation in prediction sample size.
a Between-family analyses. b Within-family analyses. Data are presented as the estimated coefficients +/− 1.96 times the standard error (95% confidence interval) for the Polygenic Index (PGI) using meta-analysis (circles), Obviously Related Instrumental Variables (ORIV, rhombuses), the default PGI-RC procedure (squares), and the PGI-RC procedure, taking into account uncertainty in the GREML estimates (triangles) in the baseline scenario (no genetic nurture, no assortative mating) and holding constant the GWAS discovery sample such that the resulting meta-analysis PGI has an R2 of 15.4%. The horizontal dashed line represents the true coefficient. The simulation results are based on 100 replications.

