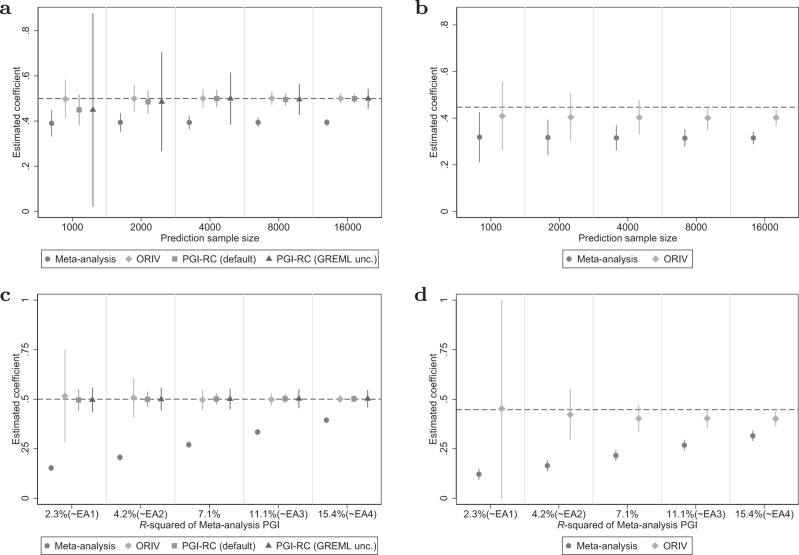
Fig. 3. Genetic nurture.
a, c Between-family analyses. b, d Within-family analyses. Data are presented as the estimated coefficients +/− 1.96 times the standard error (95% confidence interval) for the Polygenic Index (PGI) using meta-analysis (circles), Obviously Related Instrumental Variables (ORIV, rhombuses), the default PGI-RC procedure (squares), and the PGI-RC procedure, taking into account uncertainty in the GREML estimates (triangles). The top panels are for a scenario with genetic nurture but no assortative mating, and holding constant the GWAS discovery sample such that the resulting meta-analysis PGI has an R2 of 15.4%. The bottom panels are the same but now holding the discovery sample fixed at N = 16, 000. The dashed line represents the true coefficient, which is equal to 0.5 (i.e., the square root of ) in the between-family design, and equal to the square root of the direct genetic effect in the within-family design. The simulation results are based on 100 replications.

