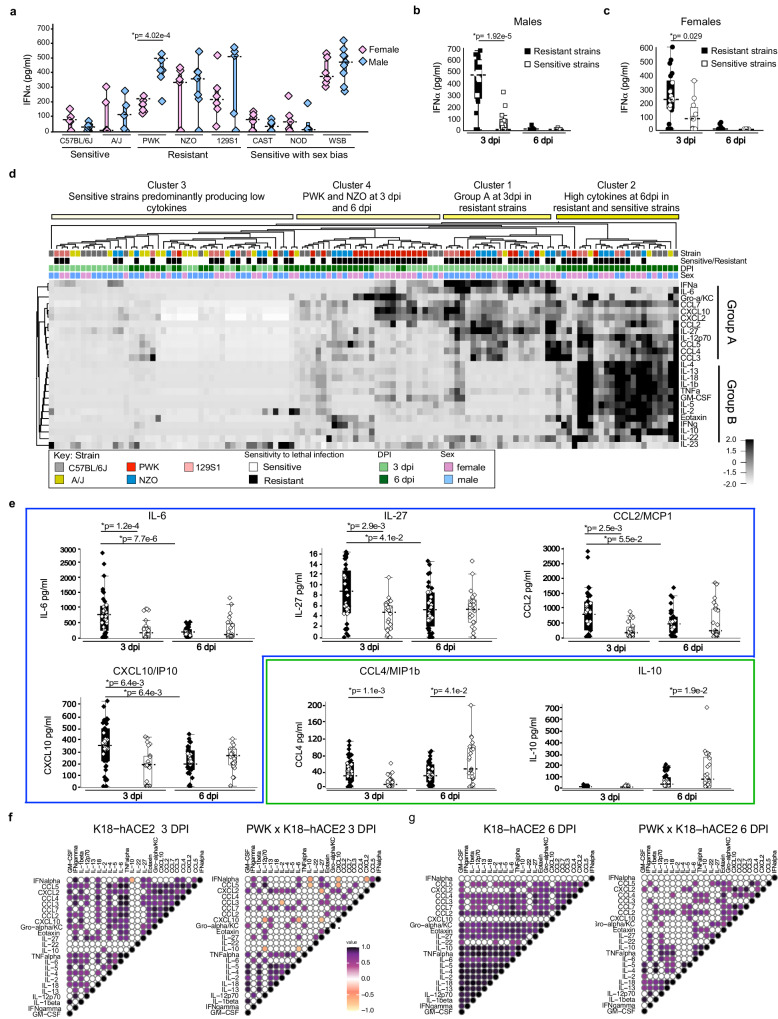
Fig. 3. Timing of IFN-I and inflammatory cytokine responses in the lung is associated with clinical severity in CC x K18-hACE2.
a Box plots of IFNα protein in BAL from CC x K18-hACE2 mice at 3 dpi. b, c IFNα protein in BAL from (b) male and (c) female resistant (PWK, NZO and 129S1 x K18-hACE2) and sensitive (K18-hACE2 and A/J x K18-hACE2) mice at 3 and 6 dpi. Biological replicates were examined over at least 2 independent experiments and the numbers of mice assessed per strain (male: female) were as follows: 3 dpi (K18-hACE2 (5:7); A/J x K18-hACE2 (5:5); PWK x K18-hACE2 (7:6); NZO x K18-hACE2 (7:7); 129S1 x K18-hACE2 (6:5); CAST x K18-hACE2 (8:6); NOD x K18-hACE2 (5:4); WSB x K18-hACE2 (6:9), and 6 dpi (K18-hACE2 (6:6); A/J x K18-hACE2 (6:7); PWK x K18-hACE2 (6:7); NZO x K18-hACE2 (7:5); 129S1 x K18-hACE2 (5:5); CAST x K18-hACE2 (8:9); NOD x K18-hACE2 (4:6); WSB x K18-hACE2 (5:7). Two-tailed Student t-test with 95% confidence interval was used to compare cytokine production in (a) male versus female for each strain, (b) resistant versus sensitive males, and (c) resistant versus sensitive females. *p < 0.05 was considered statistically significant. d Heatmap of cytokine and chemokine responses in BAL. e Box plots of resolving group A cytokines in resistant CC x K18-hACE2 mice (IL-6, IL-27, CCL2, CXCL10), or increasing group B cytokines in sensitive CC x K18-hACE2 mice (IL-10, CCL4). Box plots show data from individual mice (squares, circles, diamonds), the horizontal dashed lines represent the median value, the box indicates the first and third quartiles, and the whiskers indicate the maxima and minima values (Qlucore software). Source data are provided as a Source Data file. Two-tailed, unpaired Student’s t-test with Holm-Bonferroni multiple comparison posttest and 95% confidence interval were used to compare cytokine production in resistant versus sensitive strains (males and females combined). *p<0.05 was considered statistically significant. f, g Correlation plots of IFNα and cytokine panel for K18-hACE2 and PWK x K18-hACE2 at (f) 3 dpi and (g) 6 dpi. Correlation analyses were performed by computing Spearman’s rank correlation coefficients. Correlation tests with p < 0.001 were displayed.

