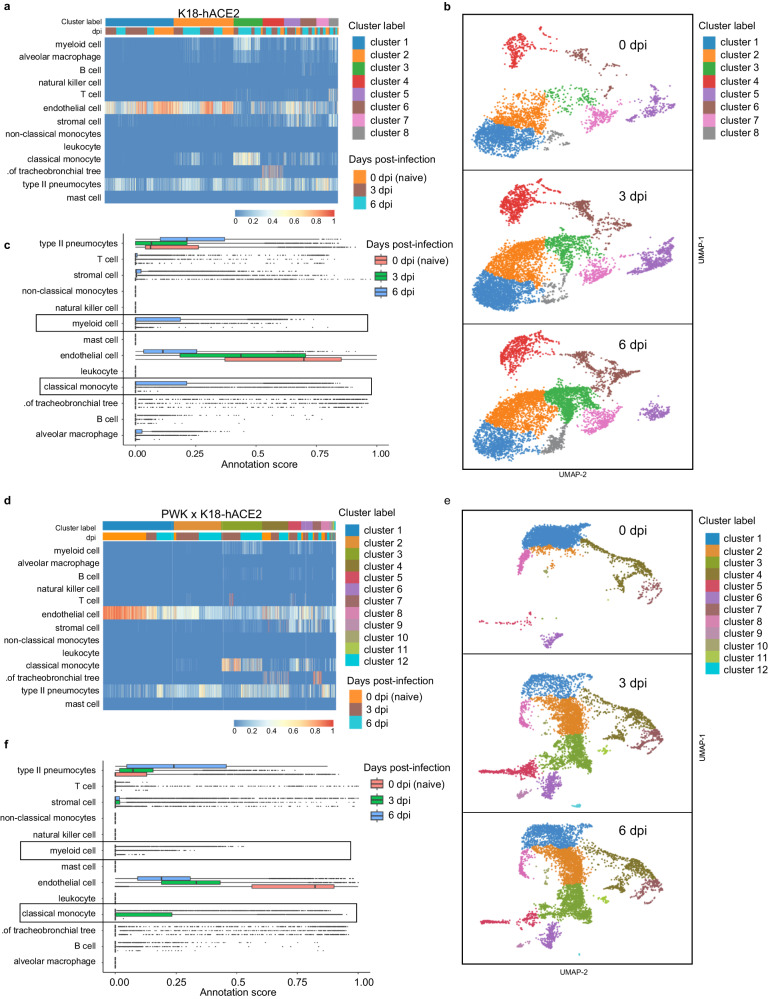
Fig. 4. Spatial transcriptomics reveals differential innate immune responses of pneumocytes, endothelial cells and monocytes in K18-hACE2 and PWK x K18-hACE2 mice.
10x Genomics Visium spatial transcriptomic analysis of lung sections from K18-hACE2 and PWK x K18-hACE2 at 0 (naïve), 3 and 6 dpi following SARS-CoV-2 inoculation. a, d Confidence scores for cell type annotations based on unsupervised cluster analysis in K18-hACE2 (a) and PWK x K18-hACE2 (d). b, e Bar graph of cell annotations scores in K18-hACE2 (b) and PWK x K18-hACE2 (e). c, f UMAP representation of identified transcriptional clusters in K18-hACE2 (c) and PWK x K18-hACE2 (f).

