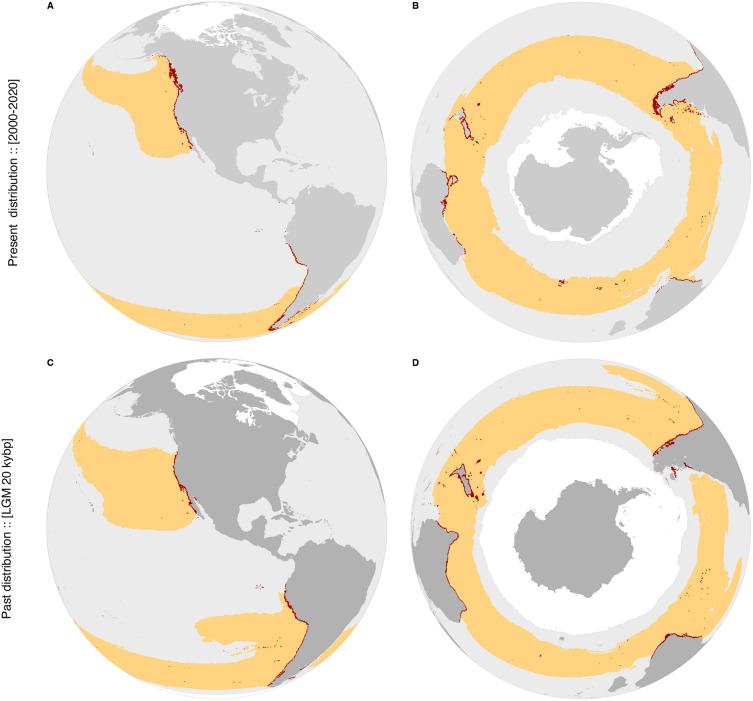
Figure 1.
Potential distribution of Macrocystis pyrifera estimated with Species Distribution Modelling for (panels A and B) the present and (panels C and D) the last glacial maximum (yellow and red colors depicting surface and subtidal habitats down to 30 m depth, respectively). Sea ice extent is depicted in white. Detailed maps per continent available in Figs. 6–9 in S3. Occurrence records used in Species Distribution Modelling in Fig. 10 in S3.

