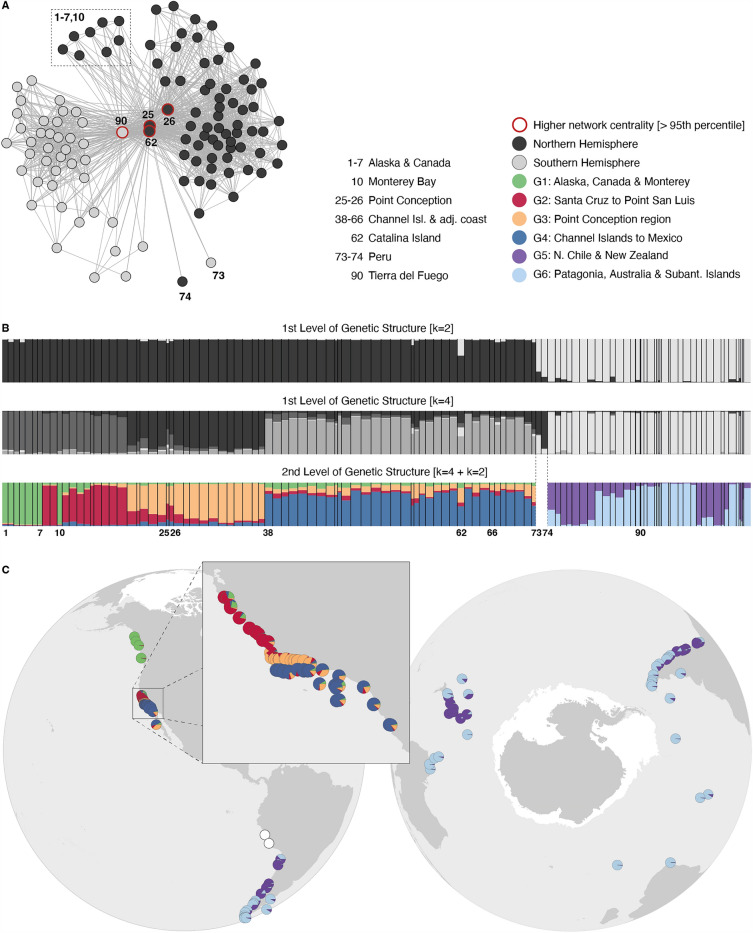
Figure 2.
Genetic structure of Macrocystis pyrifera. (panel A) Network analysis based on shared allele distance. Red circles in the network identify sites with higher network centrality (> 95th percentile of centrality). (panel B) Structure analysis for the first and second hierarchical levels of subdivision with bars representing the proportion of individual assignments to each cluster. Analyses using the DeltaK criterion68 to infer the number of K clusters available in S3: first hierarchical level with K = 2 or 4; second hierarchical level with K = 4 and K = 2. Colors depict distinct genetic groups and the numbers label populations of interest. (panel C) Second hierarchical level of genetic subdivision (proportion of individual assignments to each cluster). Sea ice extent is depicted in white.

