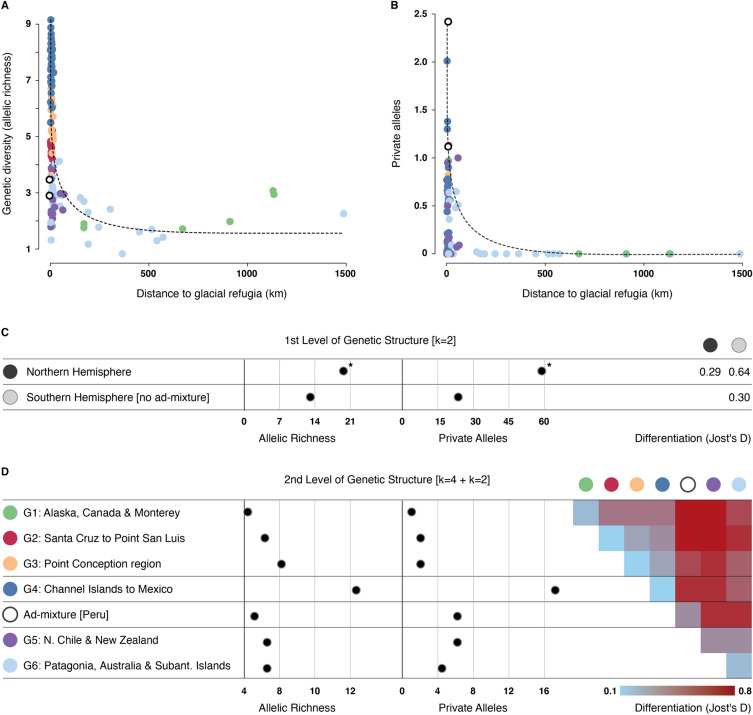
Figure 3.
Standardized genetic diversity per site as a function of (panels A and B) distance to closest glacial refugia (version considering the natural logarithm of distance in Fig. 4 in S3). Colors depicting the assignment of populations to the different genetic clusters (as in Fig. 2). Standardized diversity per genetic group for the (panel C) first and (panel D) second hierarchical levels of genetic subdivision. Population pairwise differentiation (Jost's D, average) between genetic groups inferred for the (panel C) first and (panel D) second levels of genetic subdivision. Asterisks depict groups with significantly higher genetic diversity.

