Figure 2.

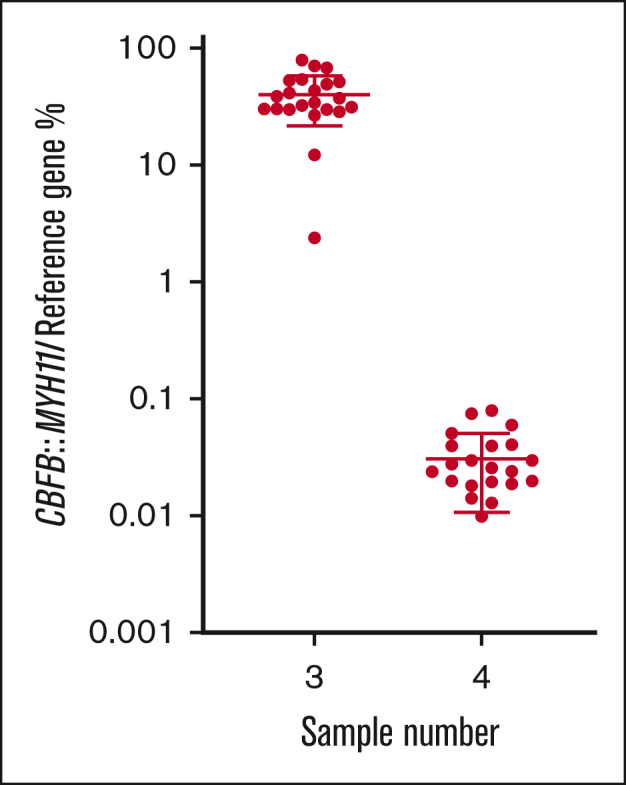
% normalized ratio returned by all participants reporting CBFB::MYH11 MRD levels in samples 3 and 4. Long horizontal line represents average. Short horizontal line represents standard deviation.

% normalized ratio returned by all participants reporting CBFB::MYH11 MRD levels in samples 3 and 4. Long horizontal line represents average. Short horizontal line represents standard deviation.