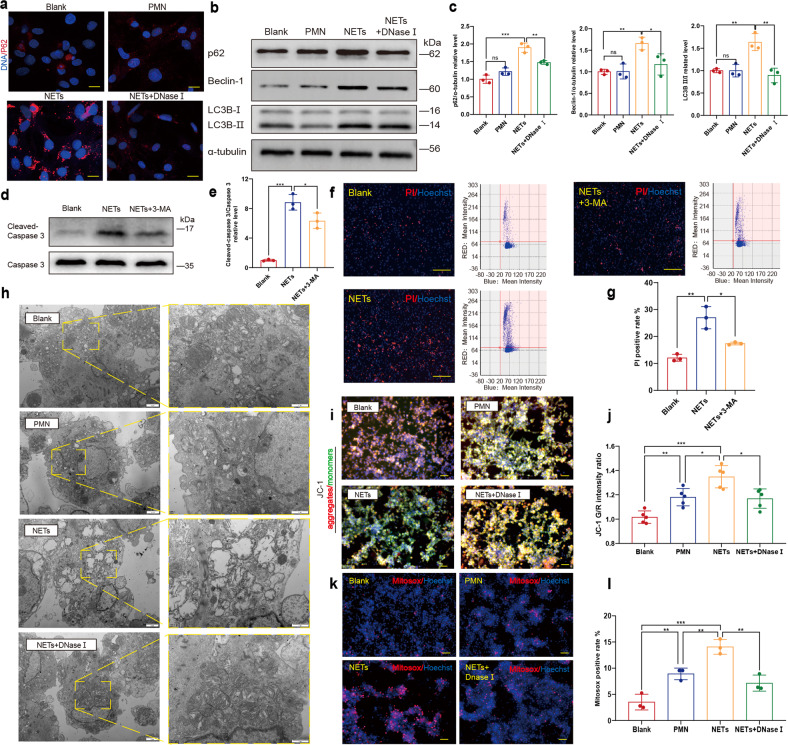
Fig. 2.
NETs induce the autophagic cell death and mitochondrial injury of cardiomyocytes through the upregulation of autophagy. a Increased p62 positive granules in cardiomyocytes incubated with NETs demonstrated by IF staining microscopy. Cells in 24-well plate on coverslips were stained for DNA (blue) and p62 (red). p62 positive granules were imaged with a confocal laser-scanning microscope. Scale bar: 10 μm. b, c In vitro p62, Beclin-1 and LC3B II/I were all upregulated in cardiomyocytes incubated with NETs (n = 3). d, e In vitro 3-MA partly compromised the upregulation of cleaved- caspase 3 in cardiomyocytes induced by NETs (n = 3). f, g Death rate of cardiomyocytes measured by Celigo analysis in the presence or absence of NETs and NETs+3MA (n = 3). Cells in 96 well plate were stained for all DNA (blue) and nucleuses of dead cells (red). Scale bar: 100 μm. Hoechst single-positive cell was defined as the living, while Hoechst and PI double-positive cell was defined as the dead. h In vitro mitochondrial morphology damage was induced by NETs in cardiomyocytes, including swelling and reduction of cristae. Mitochondria were imaged with transmission electron microscope. Scale bar: 1 μm or 2 μm. i, j In vitro mitochondrial membrane potential was decreased in cardiomyocytes incubated with NETs (n = 5). The mitochondrial membrane potential of cardiomyocytes in 6-well plate in the presence or absence of NETs, degraded NETs with DNase I and supernatants of PMN using JC-1 and Hoechst was imaged by fluorescence microscope. Scale bar: 50 μm. The mitochondrial membrane potential of cardiomyocytes in 96-well plate was measured by fluorescence microplate reader. k, l In vitro excessive mtROS was produced in cardiomyocytes incubated with NETs (n = 3). Cells in 6-well and 96-well plate were stained for DNA (blue) and mtROS (red). mtROS of cardiomyocytes in 6-well plate in the presence or absence of NETs, degraded NETs with DNase I and supernatants of PMN using mitoSOX and Hoechst was imaged by Fluorescence microscope. Scale bar: 50 μm. Cardiomyocytes in 96well plate of increased mtROS production was compared by Celigo analysis. PMN polymorphonuclear leukocytes, mtROS mitochondrial reactive oxygen species. PI propidium iodide. *P < 0.05, **P < 0.01, ***P < 0.001, ns (not significant). Data were presented as mean ± SD

