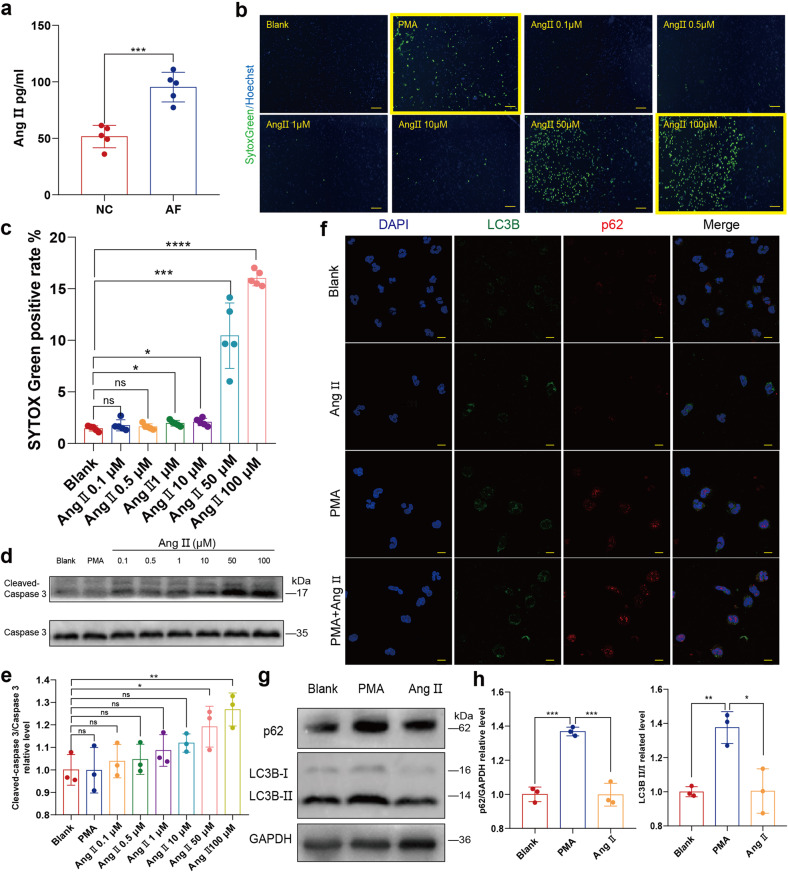
Fig. 3.
Ang II could not initiate NETosis. a ELISA experiment comparing Ang II in peripheral blood of patients with AF and normal control (n = 5). b, c Neutrophils of cfDNA measured by Celigo analysis in the presence or absence of PMA and Ang II of different concentration (0.1 μM, 0.5 μM, 1 μM, 10 μM, 50 μM or 100 μM) (n = 5). Neutrophils deprived from peripheral blood of the donator in 96-well plate was stained for all DNA (blue) and cfDNA (green). Scale bar: 100 μm. Hoechst single positive cell was defined as the living, while Hoechst and SYTOX Green double positive cell was defined as the neutrophil with cfDNA. Representatives with yellow frame demonstrate that despite the increase of SYTOX Green positive rate induced by Ang II, no linear or reticular DNA structure was identified. d, e Apoptosis analysis of Neutrophils incubated with PMA or Ang II of different concentration (0.1 μM, 0.5 μM, 1 μM, 10 μM, 50 μM or 100 μM) by comparing cleaved caspase 3/ caspase 3 ratio determined through WB(n = 3). f In vitro autophagy was not upregulated in neutrophils incubated with Ang II alone. Neutrophils in 24-well plate on coverslips were stained for DNA (blue), LC3B (green) and p62 (red). p62 or LC3B positive subcellular structures were imaged with a confocal laser-scanning microscope. Scale bar: 10 μm. g, h Analysis of the effect of Ang II on autophagy in neutrophils by comparing p62 and LC3B II/I ratio determined through WB (n = 3). Ang II angiotensin II, PMA Phorbol 12-myristate 13-acetate. *P˂0.05, **P < 0.01, ***P < 0.001, ****P < 0.0001, ns (not significant). Data were presented as mean ± SD

