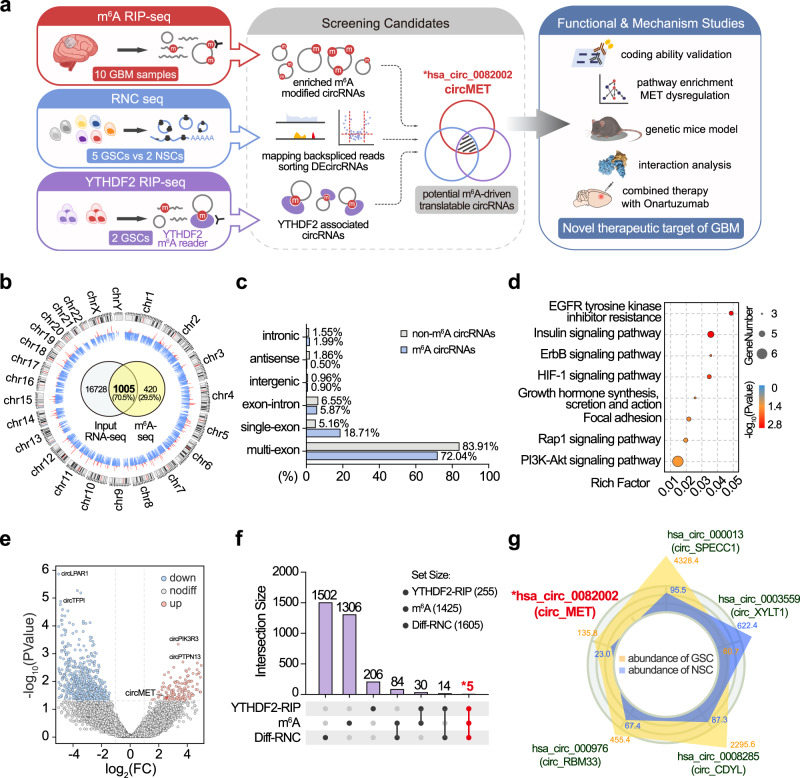
Fig. 1. CircMET is a potential coding circRNA subjected to m6A modification.
a Experimental strategy. GSC, glioma stem cell. NSC, neural stem cell. DEcircRNAs, differentially expressed circRNAs. b Circos plot shows the genome-wide m6A-modified circRNAs in GBM tissues. The outer circle represents the karyotype and centromere of chromosomes. The height of blue and red ticks represents the number of circRNAs detected (1~10) in input RNA-seq or m6A-seq, respectively. The Venn diagram in the centre illustrates the exact number of circRNAs detected in the m6A-seq and RNA-seq input data. c Proportion of the source regions of m6A circRNAs and non-m6A circRNAs. d KEGG enrichment analysis of the source genes of m6A circRNAs. Hypergeometric test. The exact P values are provided in Supplementary Data 2. e Volcano plot showing differentially expressed circRNAs between GSCs and NSCs identified from the RNC-seq data. f Upset plot illustrating the number of circRNAs detected by m6A-seq, RNC-seq and YTHDF2 RIP-seq. g Five candidate circRNAs were screened from the overlap of the m6A-seq, RNC-seq and YTHDF2 RIP-seq data. The yellow and blue polygons represent the RNC-seq expression levels of circRNAs in GSCs and NSCs, respectively. Source data are provided in the supplementary datasets.

