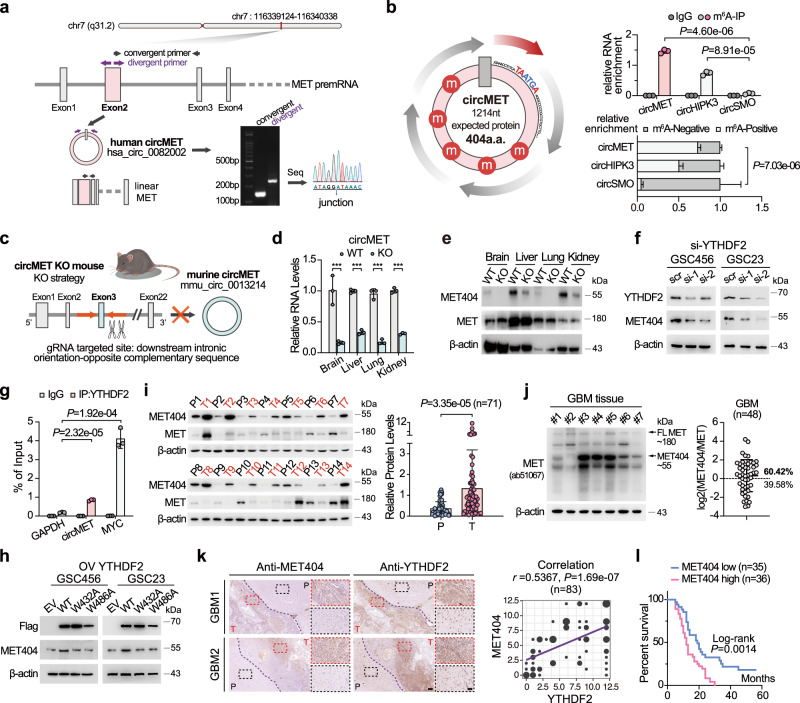
Fig. 2. CircMET encodes the protein MET404 driven by the m6A reader YTHDF2.
a Illustration of the annotated genomic region of human circMET, different splicing forms of MET premRNA, and the validation strategy for the existence of circular MET exon 2. Convergent (black) and divergent (purple) primers were designed to amplify the linear or back-spliced products. PCR analysis followed by Sanger sequencing using the indicated divergent primers revealed the “head-to-tail” splicing of human MET exon 2. b Left, illustration of the ORF and m6A modifications of circMET. Upper right, GSC23 cells were subjected to N6-methyladenosine immunoprecipitation (m6A IP) using an anti-m6A antibody or IgG control. The immunoprecipitates were analysed by RT-qPCR with specific primers for circMET, circHIPK3 (positive control) and circSMO (negative control). n = 3 independent experiments. M6A-IP, circMET vs circSMO, P = 4.60e−06; circHIPK3 vs circSMO, P = 8.91e−05. Lower right, RNAs from the eluate (m6A positive) and supernatant (m6A negative) after m6A immunoprecipitation were purified and subjected to subsequent RT-qPCR analysis using the indicated primers. n = 3 independent experiments. circMET vs circSMO, P = 7.03e−06. c Schematic strategy of the circMET knock-out (KO) mouse model using CRISPR/Cas9 technology. Guide RNAs (gRNAs) were designed to target downstream introns containing orientation-opposite complementary sequences that facilitate the circulation of exon 3 of mouse MET premRNA. d CircMET RNA levels in the indicated organs of the circMET KO mouse model. n = 3 independent experiments. Brain, P = 3.46e−03; Liver, P = 1.90e−05; Lung, P = 1.24e−04; Kidney, P = 1.08e−05. e Protein levels of MET404 and MET in the indicated organs of the wild-type (WT) and circMET KO mouse models. Representative of three independent experiments. f Protein levels of MET404 in YTHDF2-siRNA-transfected GSC456 and GSC23 cells. Representative of three independent experiments. g GSC23 cells were subjected to RNA immunoprecipitation using an anti-YTHDF2 antibody or IgG control and subsequent RT–qPCR analysis with specific primers for circMET, MYC (positive control) and GAPDH (negative control). n = 3 independent experiments. IP YTHDF2, circMET vs GAPDH, P = 2.32e−05; MYC vs GAPDH, P = 1.92e−04. h Protein levels of MET404 in GSC456 and GSC23 cells transfected with empty vector (EV), wild-type (WT) YTHDF2, or mutated YTHDF2 (W432A and W486A). Representative of three independent experiments. i Left, representative expression levels of MET404 and MET in 14 randomly selected independent paired GBM samples. P, peritumour tissue. T, tumour. Right, semiquantitative analysis of MET404 expression levels based on immunoblot greyscale analysis in a cohort of 71 independent GBM samples. Two-tailed paired t test, P = 3.35e−05. j Left, representative expression levels of MET and MET404 in 7 randomly selected independent GBM cancerous tissues detected using an antibody that simultaneously recognizes MET and MET404. Right, semiquantitative analysis of the ratio of MET404 to MET expression levels based on immunoblot greyscale analysis (n = 48). k Left, representative immunohistochemical (IHC) images showing the spatial correlation of MET404 and YTHDF2 from two GBM samples. The dark purple dashed lines indicate the border of the tumour. P, peritumour tissue. T, tumour. Scale bar, 250 μm. The magnified view is shown inside the dashed box. Scale bar, 100 μm. Right, correlation analysis of MET404 and YTHDF2 expression levels based on IHC scores obtained from a cohort of 83 independent GBM samples. r = 0.5367, P = 1.69e−07. l Survival analysis of the aforementioned GBM cohort of 71 patients stratified by MET404 expression (with median expression level as the cut-off value). Log-rank test, P = 0.0014. The data are presented as the mean ± SD. Unpaired two-tailed Student’s t test was used to determine the significance of the differences between the indicated groups where applicable. *P < 0.05; **P < 0.01; ***P < 0.001. Source data are provided as a Source data file.

