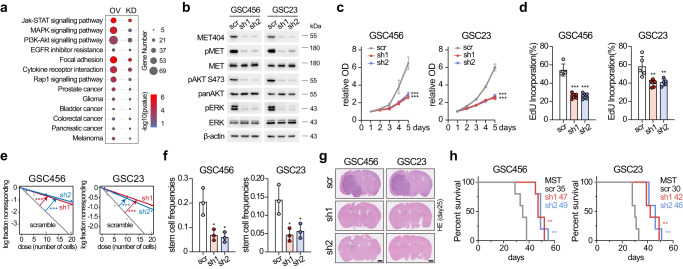
Fig. 3. MET404 promotes GBM tumorigenesis by activating MET signalling.
a Bubble plot of the KEGG enrichment analysis results based on bulk RNA-seq data of GSCs with stable knockdown (KD) or overexpression (OE). n = 3 biologically independent samples for each group. b Protein levels of phospho-MET and downstream phospho-AKT (S473) and phospho-ERK signals in stable circMET KD cells. Representative of three independent experiments. c Proliferation of control and circMET stable KD GSC456 and GSC23 cells. n = 5 independent experiments. Two-way ANOVA test. GSC456, scr vs sh1, P = 3.0e−15; scr vs sh2, P = 1.8e−14. GSC23, scr vs sh1, P < 1.0e−15; scr vs sh2, P < 1.0e−15. d Quantification of the EdU incorporation assay of the control and stable circMET KD GSC456 and GSC23 cells. n = 5 independent experiments. GSC456, scr vs sh1, P = 2.3e−05; scr vs sh2, P = 2.4e−05. GSC23, scr vs sh1, P = 0.0081; scr vs sh2, P = 0.011. e Limited dilution assay (LDA) analysis of the control and stable circMET KD GSC456 and GSC23 cells. n = 3 independent experiments. GSC456, scr vs sh1, P = 4.78e−07; scr vs sh2, P = 1.88e−08. GSC23, scr vs sh1, P = 1.05e−06; scr vs sh2, P = 3.64e−05. f Stem cell frequencies of LDA analysis of the control and stable circMET KD GSC456 and GSC23 cells. n = 3 independent experiments.GSC456, scr vs sh1, P = 0.0176; scr vs sh2, P = 0.0136. GSC23, scr vs sh1, P = 0.0194; scr vs sh2, P = 0.0298. g Representative haematoxylin and eosin (H&E)-stained brain slices from mice intracranially injected with the control and stable circMET KD GSC456 and GSC23 cells (n = 5 per group). Scale bar, 1 mm. h Survival analysis of mice intracranially injected with the control and stable circMET KD GSC456 and GSC23 cells (n = 5 per group). Log-rank test. GSC456, scr vs sh1, P = 0.0043; scr vs sh2, P = 0.0043. GSC23, scr vs sh1, P = 0.0017; scr vs sh2, P = 0.0017. The data are presented as the mean ± SD. The statistical tests are two-sided unless otherwise specified. Unpaired Student’s t test was used to determine the significance of the differences between the indicated groups where applicable. *P < 0.05; **P < 0.01; ***P < 0.001. Source data are provided as a Source data file.

