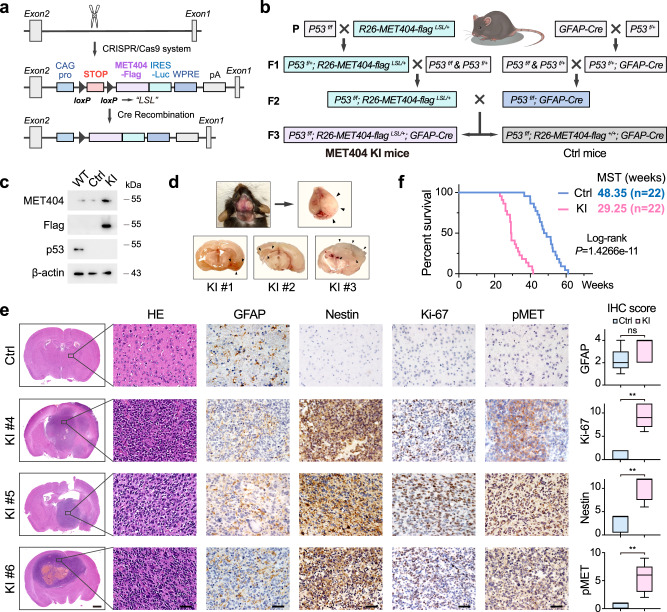
Fig. 4. MET404 conditional knock-in initiates GBM in a genetic mouse model.
a Schematic illustration of CRISPR/Cas9 system-mediated knock-in (KI) of MET404 at the mouse Rosa26 locus. b Illustration of the crossing strategy of the GBM spontaneous mouse model with conditional MET404 KI (MET404 KI mouse, P53f/f; R26-MET404-flagLSL/+; GFAP-Cre) and control mice (P53f/f; R26-MET404-flag+/+; GFAP-Cre). “+” indicates the wild-type allele, and “f” denotes the conditional allele. c Immunoblotting of MET404-Flag and p53 in brain tissues from the indicated mice. Representative of three independent experiments. d Upper left, representative photograph of a MET404 KI mouse with a middle incision in its skull. Upper right, the swollen brain removed from the skull of the mouse on the left. Bottom, representative brain slice photograph from three MET404 KI mice. The black arrows denote the edge of the tumour mass. e Left, representative H&E-stained and IHC images of MET404 KI and control mice using anti-GFAP, anti-Nestin, anti-Ki-67 and anti-phospho-MET antibodies. Scale bar, 1 mm (for H&E-stained whole brain slices); 50 μm (for enlarged H&E-stained brain slices and IHC images). Right, IHC scoring of the indicated proteins in randomly selected microscopy fields of each IHC image (n = 5 independent mouse samples). The data are presented as box plots containing the median (centre line), the first and third quartiles (box limits). The whiskers indicate the maxima and minima. Two-sided Mann–Whitney test. GFAP, P = 0.3651; Ki-67, P = 0.0079; Nestin, P = 0.0079; pMET, P = 0.0079. f Survival analysis of conditional MET404 KI and control mice (n = 22 per group). Log-rank test, P = 1.4266e−11. Source data are provided as a Source data file.

