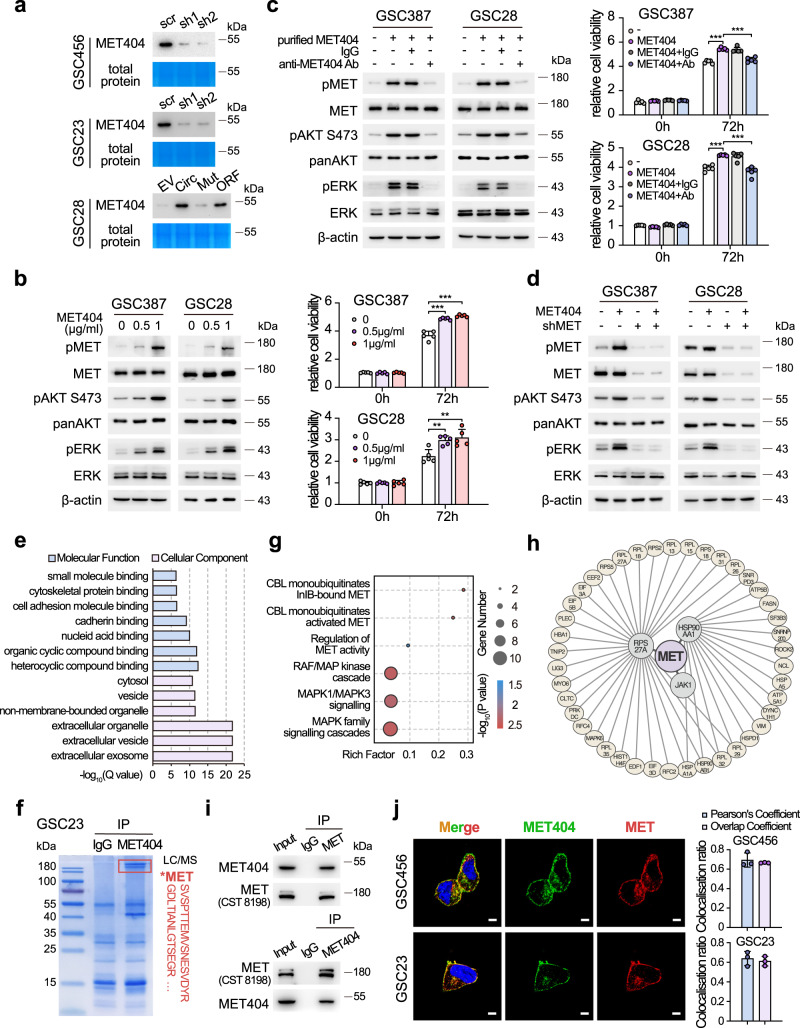
Fig. 5. MET404 is a secreted protein that interacts with MET.
a Immunoblot of concentrated supernatant from the culture medium of GSC456, GSC23 and GSC28 cells with the indicated modifications. EV, empty vector; Circ, stable OE of circMET; Mut, stable OE of circMET with insertion mutation; ORF, stable OE of linearized MET404 ORF vector. Coomassie blue-stained total proteins were used as a loading control. b Left, protein levels of phospho-MET and downstream phospho-AKT (S473) and phospho-ERK in GSC387 and GSC28 cells after treatment with purified MET404 at the indicated concentrations. Right, proliferation of GSC387 and GSC28 cells after the indicated treatments. n = 5 independent experiments. c Left, protein levels of phospho-MET and downstream phospho-AKT (S473) and phospho-ERK in GSC387 and GSC28 cells treated with purified MET404 (1 µg/ml). Specific MET404-neutralizing antibody or IgG control was added as indicated. Right, proliferation of GSC387 and GSC28 cells after the indicated treatments. n = 5 independent experiments. 0 vs 0.5 µg/ml, GSC387 P = 3.34e−05, GSC28 P = 0.0022; 0 vs 1.0 µg/ml, GSC387 P = 1.09e−05, GSC28 P = 0.0049. d Protein levels of phospho-MET and downstream phospho-AKT (S473) and phospho-ERK in GSC387 and GSC28 cells with purified MET404 (1 µg/ml), MET stable KD or both. Ctrl vs MET404, GSC387 P = 7.05e−07, GSC28 P = 1.18e−05; MET404 vs MET404+Ab, GSC387 P = 1.86e−05, GSC28 P = 5.83e−05. e Gene Ontology analysis of candidate MET404-binding partners. f Identification of MET sequences in GSC23 cells immunoprecipitated by an anti-MET antibody using mass spectrometry analysis. g Reactome pathway analysis of candidate MET404-binding partners. h Protein interaction network with MET as the hub generated using the STRING database based on candidate MET404-binding partners. i Whole GSC23 cell lysates were subjected to immunoprecipitation using anti-MET404 and anti-MET antibodies followed by immunoblotting with anti-MET404 and anti-MET antibodies. j Left, representative immunofluorescence images of the colocalization of MET404 and MET in GSC456 and GSC23 cells. Scale bar, 5 μm. Right, statistical analysis of GSC456 and GSC23 cells with MET404 and MET colocalization (n = 3 independent experiments). The data in (a–d), (f), (i) and (j) were representative of three independent experiments. The data are presented as the mean ± SD. Unpaired two-tailed Student’s t test was used to determine the significance of the differences between the indicated groups where applicable. *P < 0.05; **P < 0.01; ***P < 0.001. Source data are provided as a Source data file.

