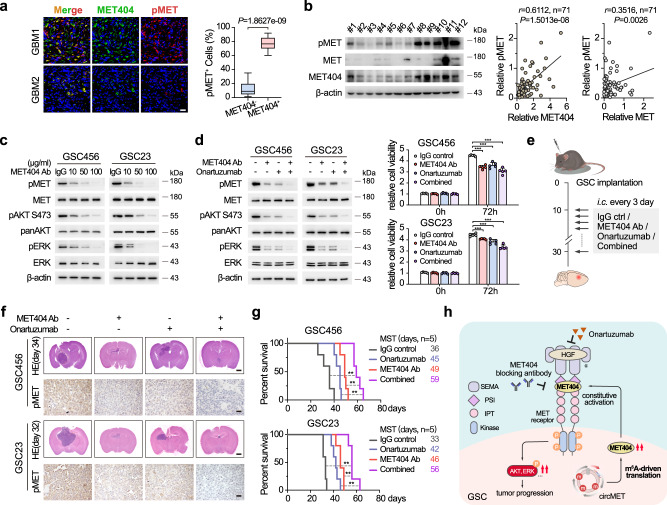
Fig. 7. Synergistic effects of targeting MET404 and onartuzumab in restraining GBM progression.
a Left, representative IF images of MET404 and phospho-MET in GBM specimens. Scale bar, 30 μm. Right, proportion of phospho-MET-positive cells among MET404-positive or MET404-negative cells in randomly selected microscopy fields of each IF image (n = 30 independent GBM samples). The data are presented as box plots containing the median (centre line), the first and third quartiles (box limits). The whiskers indicate the maxima and minima. Two-sided Wilcoxon test, P = 1.8627e−09. b Left, representative immunoblot of phospho-MET, MET and MET404 in 12 randomly selected independent GBM samples. Right, correlation analysis of MET404 vs. phospho-MET and MET vs. phospho-MET in a cohort of 71 independent GBM samples. r = 0.6112, P = 1.5013e−8 (MET404 vs. phospho-MET); r = 0.3516, two-sided Student’s t test, P = 0.0026 (MET vs. phospho-MET). c Protein levels of phospho-MET and downstream phospho-AKT (S473) and phospho-ERK in GSC456 and GSC23 cells after treatment with a specific MET404 antibody at the indicated concentrations. Representative of three independent experiments. d Left, protein levels of phospho-MET and downstream phospho-AKT (S473) and phospho-ERK in GSC456 and GSC23 cells treated with MET404 antibody, onartuzumab or both. Representative of three independent experiments. Right panel, proliferation of GSC456 and GSC23 cells treated as indicated. n = 5 independent experiments. The data are presented as mean ± SD. Unpaired two-tailed Student’s t test. GSC456, IgG vs MET404 Ab, P = 1.09e−06; IgG vs Onar, P = 7.37e−05; IgG vs Combined, P = 3.20e−06. GSC23, IgG vs MET404 Ab, P = 2.94e−04; IgG vs Onar, P = 5.13e−04; IgG vs Combined, P = 6.46e−06. e Illustration of the in situ GBM model using nude mice treated with anti-MET404, onartuzumab or combination therapy. i.c., intracranial injection. f Representative H&E-stained brain slices and representative IHC images showing the phospho-MET levels in mice implanted with GSC456 or GSC23 and treated with anti-MET404, onartuzumab or both (n = 5 per group). Scale bar, 1 mm (H&E-stained brain slices) or 30 μm (IHC images). g Survival analysis of mice subjected to the indicated therapeutic strategy (n = 5 per group). Log-rank test. GSC456, IgG vs Combined, P = 0.0021; MET404 Ab vs Combined, P = 0.0018; Onar vs Combined, P = 0.0021. GSC23, IgG vs Combined, P = 0.0019; MET404 Ab vs Combined, P = 0.0026; Onar vs Combined, P = 0.0018. h Summary diagram of the study. Source data are provided as a Source data file.

