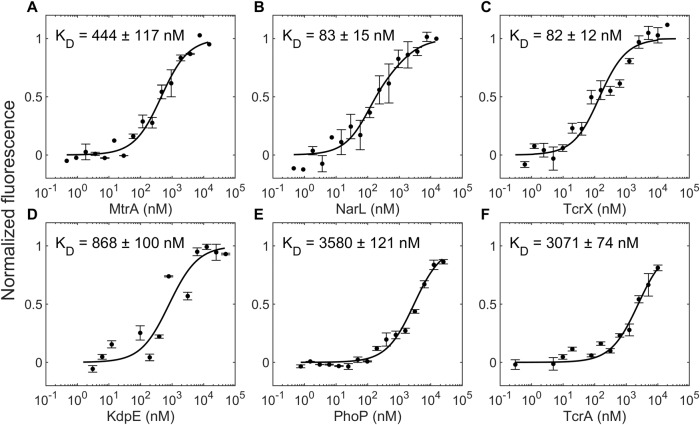
Fig. 1. Binding affinities of phosphorylated MtrB for cognate and non-cognate RRs.
Normalized fluorescence intensity obtained from microscale thermophoresis (see “Methods” section) of 50 nM of fluorescently tagged MtrB post autophosphorylation, P~MtrB-GFP, as a function of the concentration of the titrant RR (concentration range): A MtrA (0.45 nM to 15 μM), B NarL (0.46 nM to 15 μM), C TcrX (0.61 nM to 10 μM), D KdpE (3.1 nM to 50 μM), E PhoP (0.76 nM to 25 μM), and F TcrA (0.31 nM to 10 μM). The resulting KD values are indicated. Curves are best-fits and symbols are mean ± S.E.M (n = 4 independent experiments for MtrB~P with TcrX and n = 3 independent experiments for the remaining plots).

