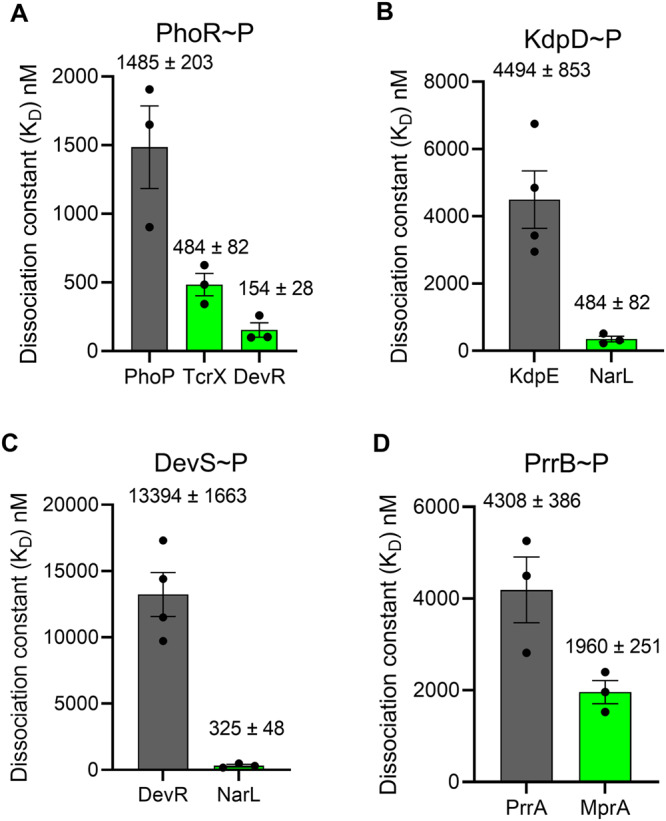
Fig. 2. Binding affinities of several HKs for their cognate and non-cognate RRs.

Affinities measured as in Fig. 1 for phosphorylated (A) PhoR, (B) KdpD, (C) DevS, and (D) PrrB, for their respective cognate (gray) and some non-cognate (green) RRs implicated in crosstalk with the HKs. The affinities as mean ± S.E.M. from at least three repeats are indicated. Detailed measurements leading to the affinity estimates are in Figs. S8 and S9, including for any non-cognate RRs with weaker affinities than the cognate ones. The error bars represent mean ± S.E.M (n = 4 independent experiments for KdpD~P with KdpE and DevS~P with DevR interaction, n = 3 independent experiments for remaining bar plots).
