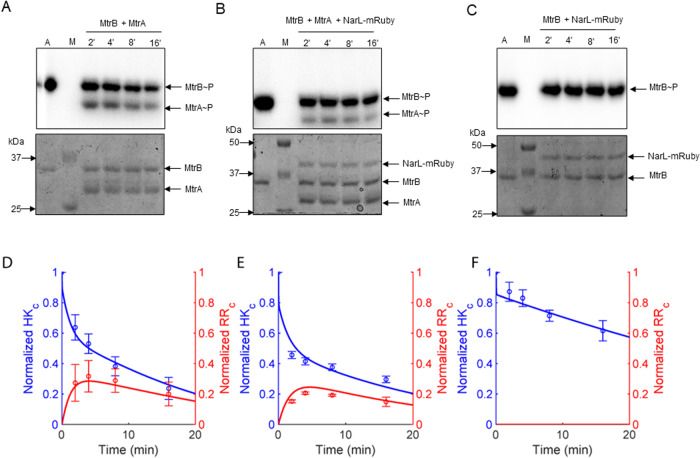
Fig. 3. Phosphotransfer kinetics from MtrB to MtrA with and without sequestration in vitro.
Time course assay of the phosphotransfer from the phosphorylated HK MtrB~P to the cognate RR MtrA in the (A) absence or (B) presence of the non-cognate RR NarL-mRuby. The concentrations used were 50 pmol for MtrB and NarL and 100 pmol for MtrA. C The same as (B) but in the absence of MtrA. M represents marker and A represents autophosphorylation control of MtrB~P. Top panels in A–C are autoradiograms and bottom panels are the corresponding Coomassie Brilliant Blue (CBB) stained gels. D–F Densitometric analysis of the time course assays in A–C, respectively, performed using autoradiograph band intensities normalized by the same band in the CBB stained gel. The autophosphorylation control was used to normalize the intensities of the individual bands. Blue symbols represent MtrB~P and red symbols MtrA~P. Lines represent best-fits of our model (“Methods” section). The error bars represent mean ± S.E.M (n = 3).

