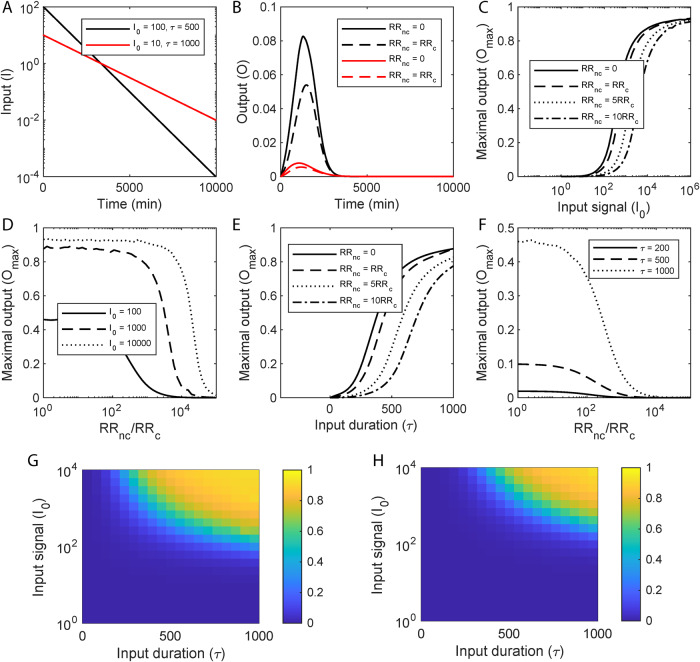
Fig. 5. Model predictions of TCS signal transduction and the impact of sequestration.
A Representative inputs, I, indicating strong but short-lived (black) and weak but extended (red) stimuli. B The corresponding outputs without (solid lines) and with (dashed lines) sequestration by a non-cognate RR. C The peak of the response (Omax) as a function of the maximum input, I0, for different extents of sequestration, determined by the ratios of the non-cognate RRs, RRnc, to the cognate RR, RRc, indicated. D Omax as a function of the ratio RRnc/RRc for different I0. E Omax as a function of the signal half-life, τ, for different values of RRnc/RRc. F Omax as a function of RRnc/RRc for different values of τ. (τ is in minutes throughout.) Heatmaps showing Omax as functions of I0 and τ in the (G) absence or (H) presence of non-cognate RRs, indicating the threshold stimulation for response shifting to higher I0 and τ with sequestration. Corresponding calculations for the total response, Ototal, are in Fig. S13. Model predictions were obtained by solving Eqs. (20–47) (“Methods” section) using parameter values listed in Table S4.

