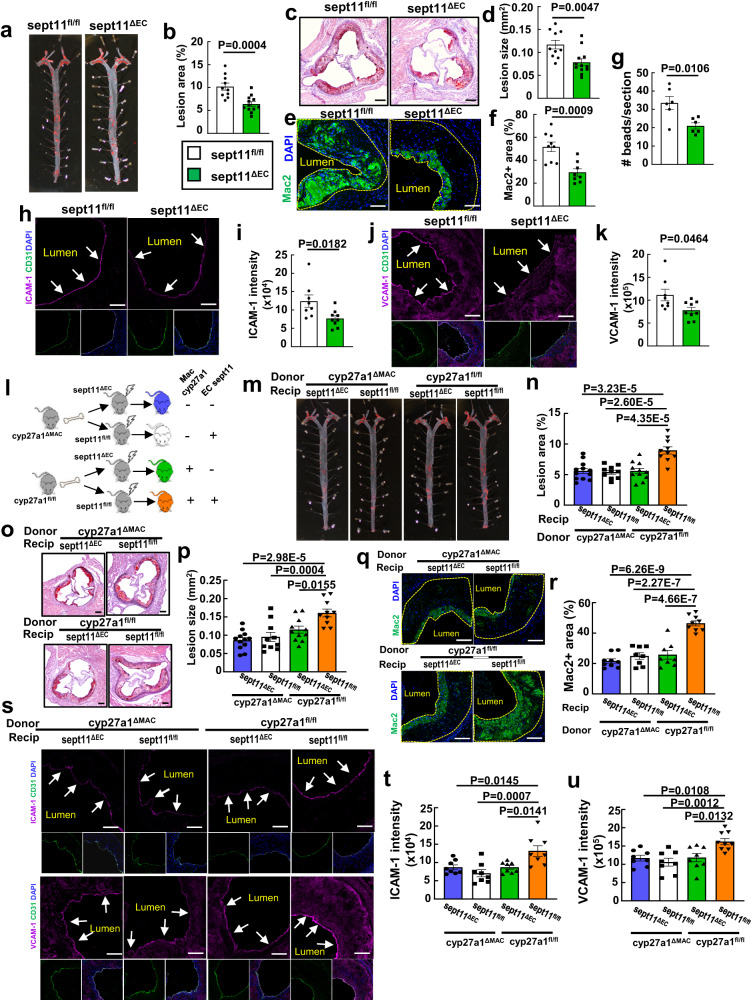
Fig. 5. Macrophage-derived 27HC drives vascular inflammation and promotes atherosclerosis via endothelial septin 11.
a-k Atherosclerosis and related parameters were assessed in apoE-/- background sept1fl/fl and sept11ΔEC mice placed on an atherogenic diet for 8 weeks post-weaning. a, b Representative lipid-stained en face images of aortas (a) and lesion areas (b; percent of total surface area, n = 10 and 12). Representative lipid and haematoxylin-stained aortic root sections (c) and lesion areas (d, n = 10 and 12). Representative immunohistochemistry images of Mac2 staining in aortic root (e; nuclei DAPI stained) and quantification of Mac2 positive staining (f; expressed per unit lesion area, n = 8-9). g, Monocyte recruitment was evaluated by YG bead incorporation into circulating monocytes and quantification of beads per aortic root section 24 h later. The quantitation was corrected for monocyte labeling efficiency. N = 6. Immunohistochemical determinations of endothelial ICAM-1 (h, i) and VCAM-1 abundance (j, k) with representative images (h, j) and quantification (i, k, n = 8-9). Arrows indicate endothelium. l–u Atherosclerosis and related parameters in bone marrow transplant experiments performed employing apoE-/- background cyp27a1fl/fl versus cyp27a1ΔMAC donors and apoE-/- background sept11fl/fl versus sept11ΔEC recipients. l Schematic of donors and recipients. Representative lipid-stained en face images of aortas (m) and lesion areas (n, n = 10-12). Representative lipid and haematoxylin-stained aortic root sections (o), and lesion areas (p, n = 10-12). Representative immunohistochemistry images of Mac2 staining in aortic root (q) and quantification of Mac2 positive staining (r, n = 8-9). s–u Immunohistochemical determinations of endothelial ICAM-1 and VCAM-1 abundance with representative images (s) and quantification (t, u, n = 8-9). Scale bar equals 100um (c, o) or 50 um (e, h, j, q, s). Data are mean ± SEM, P values by two-sided Student’s t test (b, d, f, g, and i), by two-sided Mann-Whitney (k), or by ANOVA with Tukey’s post-hoc testing (n, p, r, t and u) are shown. Source data are provided as a Source Data file.

