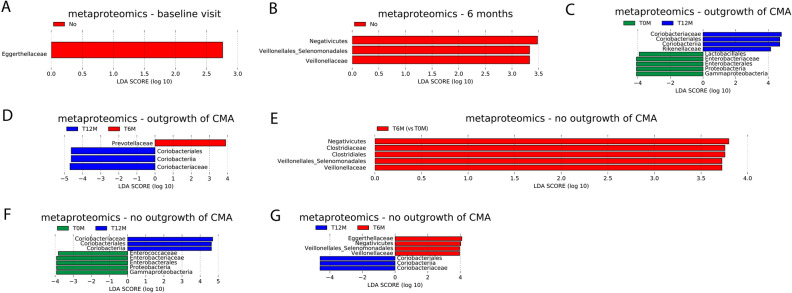
Figure 5.
LEfSe analysis of protein-based microbial relative abundances at the family and all higher taxonomic levels using an alpha value of 0.05 for the factorial Kruskal–Wallis test among classes and a threshold of 2.0 on the logarithmic LDA score for discriminative features. (A, B) Using outgrowth of CMA at visit 12 months as class, Yes: outgrowth of CMA at 12 months; no: no outgrowth of CMA at 12 months. Plot of discriminative features at (A) baseline visit; (B) visit 6 months. (C, D) Pairwise comparison between visits within the group with outgrowth of CMA, using visit as class. (C) visit 12 months (T12M) versus baseline (T0M); (D) visit 12 months (T12M) versus visit 6 months (T6M). (E–G) Pairwise comparison between visits within the group with persistent CMA, using visit as class. (E) visit 6 months (T6M) versus baseline (T0M); (F) visit 12 months (T12M) versus baseline (T0M); (G) visit 12 months (T12M) versus visit 6 months (T6M).

