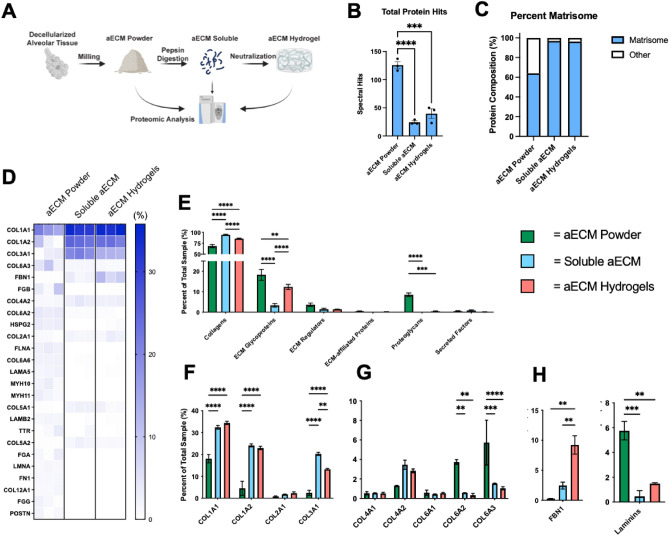
Figure 2.
Pepsin digestion significantly alters aECM protein composition. (A) Schematic demonstrating critical points during the hydrogel formation process in which samples were taken for mass spectrometry. (B) Total unique proteins identified by mass spectrometry, mean ± SEM (n = 3), ***p < 0.001, ****p < 0.0001. (C) Percentage of total matrisome composition compared to total proteins. (D) Heatmap of Top 25 ECM Proteins in aECM powder samples (percent spectral hits compared to total sample spectral hits) compared to soluble aECM and aECM hydrogels. (E) Proportion of ECM protein types compared to total ECM composition, mean ± SEM (n = 3), **p < 0.01, ***p < 0.001, ****p < 0.0001. (E) Proportion of individual ECM proteins compared to total ECM composition categorized as (F) fibrillar collagens (G) other collagens, and (H) ECM glycoproteins, mean ± SEM (n = 3), **p < 0.01, ***p < 0.001, ****p < 0.0001.

