
FIGURE 1.
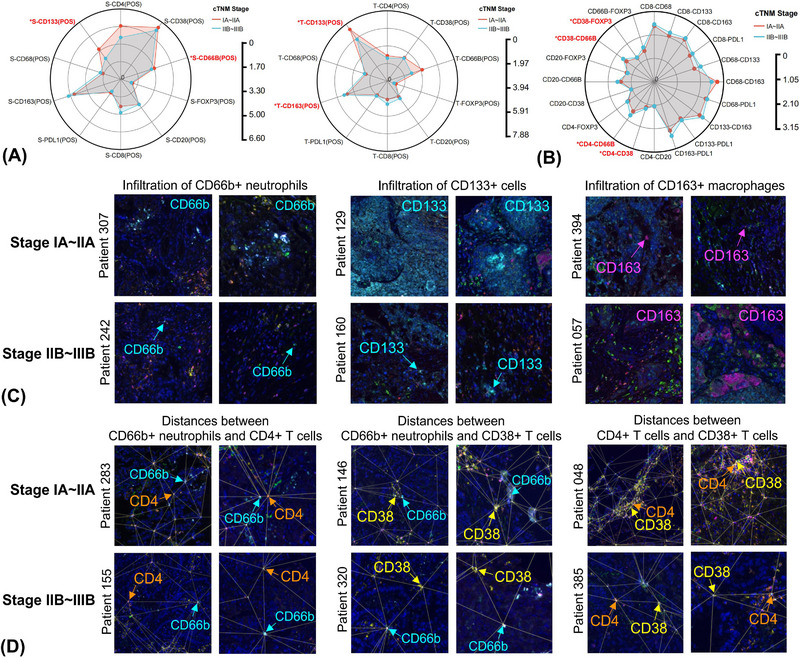
Dynamic changes of cellular composition and spatial location in the tumour microenvironment along with non‐small cell lung cancer (NSCLC) progression. Radar map comparing the cellular composition (A) and spatial distribution patterns (B) between early and middle‐to‐late‐stage NSCLC by Wilcoxon t‐test, highlighting significant findings. Representative multiplex immunofluorescence graphs depicting the changes in infiltration patterns (C) of CD66b+ neutrophils, CD133+ cells and CD163+ macrophages and spatial distances (D) of CD4+ T cells–CD66b+ neutrophils, CD38+ T cells–CD66b+ neutrophils and CD4+ T cells–CD38+ T cells between early and middle‐to‐late‐stage NSCLC within two fields from one tissue section. *p < 0.05.