
FIGURE 5.
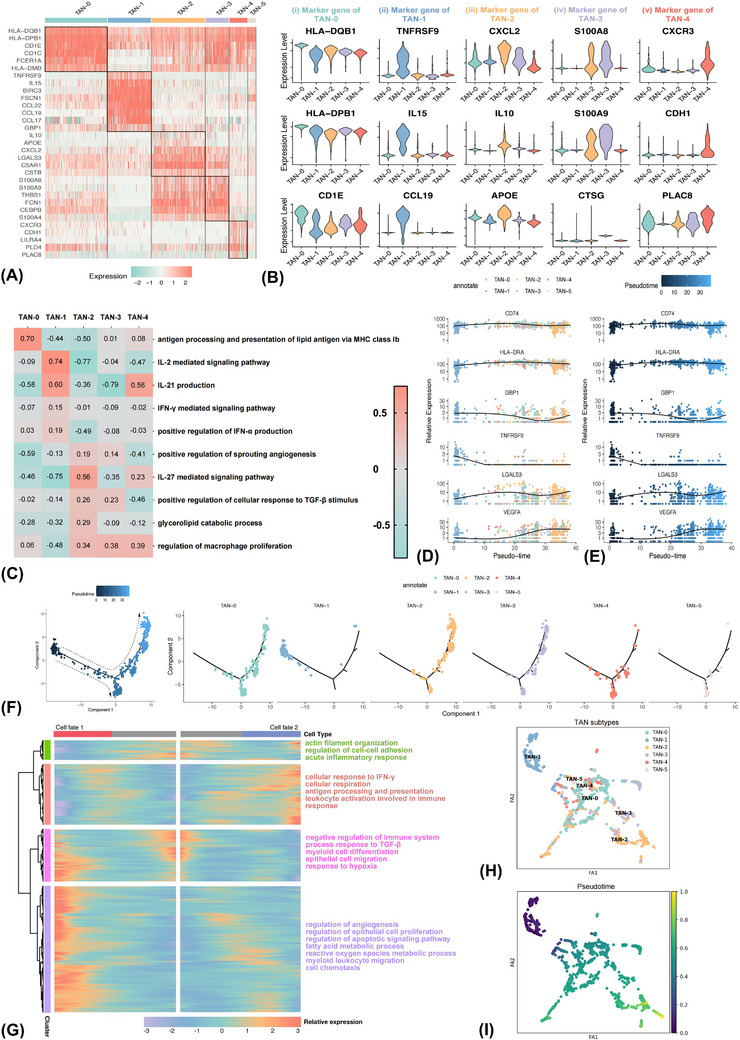
Tumour‐associated neutrophils (TAN) consist of phenotypically and functionally different subsets in the positive tumour‐draining lymph node microenvironment. Heatmap (A) and violin (B) plot showing the differential transcriptome spectrums of different TAN subsets. Gene set variation analyses comparing pathway activity among different TAN subtypes by enrichment scores (C). Two‐dimensional plots demonstrating the dynamic expressing levels of antigen presentation‐relevant genes (CD74 and HLA‐DRA), interferon‐γ stimulated gene (GBP1), costimulatory molecular‐related gene (TNFRSF9), immune regulation‐relevant gene (LGALS3) and angiogenesis related‐gene (VEGFA) along pseudotime trajectory (D and E). The trajectory of TANs along pseudotime in a two‐dimensional space was evaluated by the Monocle approach, with each point corresponding to a single cell (F). Heatmap displaying genes with dynamic expression levels along pseudotime, among which the differentially expressed genes could be hierarchically clustered into four groups with distinct enriched pathways (G). The SCANPY method validated the pseudotime analysis findings of TANs by the Monocle approach (H and I).