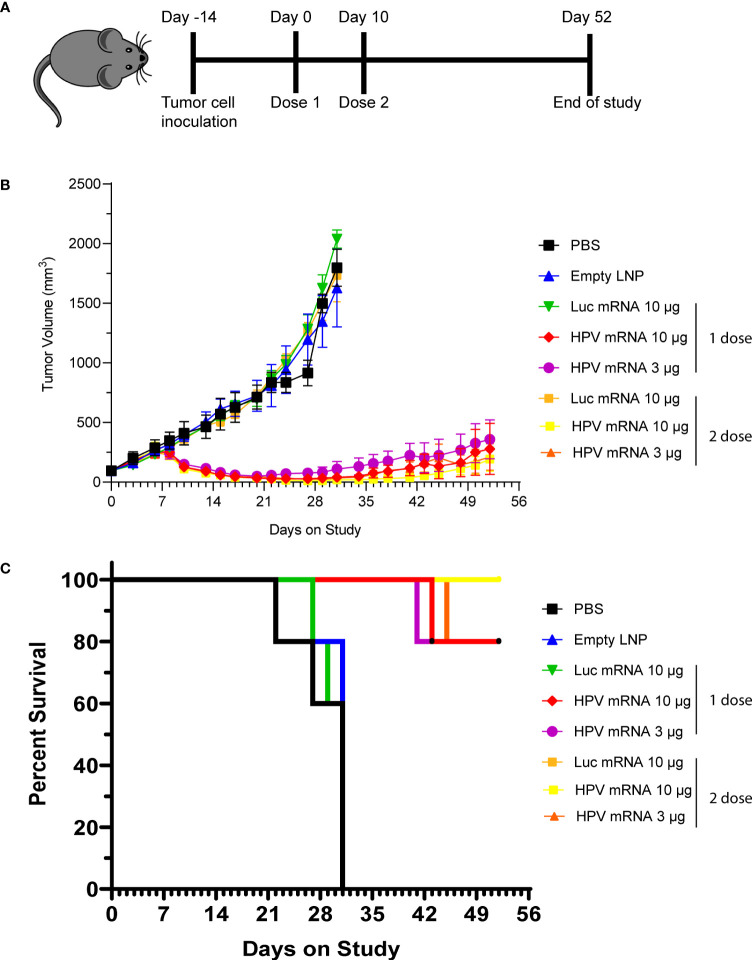
Figure 4.
(A) Schema of study design, with data presented in (B, C). (B) Tumor growth curve of C3.43 tumor bearing mice vaccinated with either a single dose or 2 doses (10 days apart) of HPV vaccine mRNA or Luciferase control mRNA. N=5 mice per group. Data presented as mean ± SEM. (C) Survival rates of C3.43 tumor bearing mice vaccinated with either a single dose or 2 doses (10 days apart) of HPV vaccine mRNA or Luciferase control mRNA. N=5 mice per group. Data presented as Kaplan-Meier curves.

